

THE SHORT ANSWER
Engagement rate is a defined set of interactions divided by a defined exposure or audience measure. There is no single formula used universally across platforms and tools. State the numerator, denominator, content sample and observation window before interpreting a percentage. The metric can describe response to content. On its own it does not establish audience authenticity, brand fit or sales performance. A meaningful comparison starts with a question, not with a preferred threshold.
One numerator can produce several valid answers
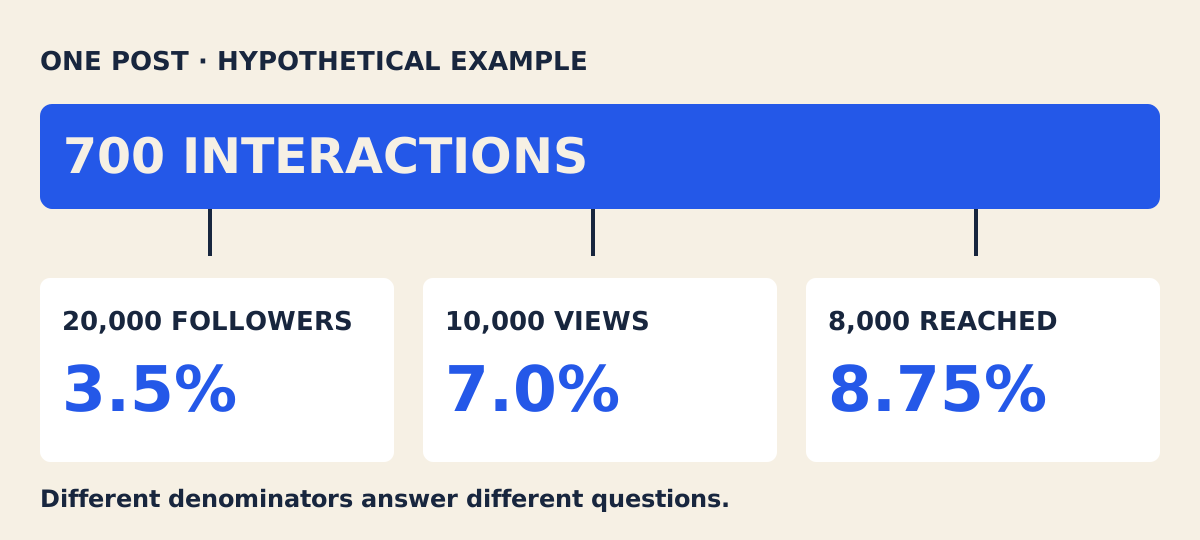
Imagine one post with 600 likes, forty comments, thirty saves and thirty shares: seven hundred interactions. The account has twenty thousand followers; the post receives ten thousand views and reaches eight thousand accounts. The hypothetical follower-based rate is 3.5%, view-based rate seven percent and reach-based rate 8.75%.
All three can be arithmetically correct. They describe different relationships. None is automatically the “real” engagement rate. The example is not a platform report or market average. A brand should choose the denominator that matches its question and preserve the other context, rather than selecting whichever percentage makes a partner look strongest.
Match the denominator to the question
A follower denominator relates response to account scale. A view denominator relates response to recorded video consumption. A reach denominator needs a comparable measure of unique accounts for the same content. Repeated views are not additional unique people, and interactions are not necessarily unique individuals either.
Recommendation-led distribution can send a post to non-followers, which changes the meaning of a follower-based percentage. A view-based percentage still cannot tell the brand how many followers belong to the target market. Decide whether the task is evaluating an asset, understanding an account or reviewing a campaign outcome. Different questions can justify different metrics without making the results directly interchangeable.
Read the tool’s actual formula
Modash currently documents median likes divided by followers for Instagram, and different interaction sets with view-based denominators for TikTok and YouTube. That is a vendor methodology, not a universal rule every campaign must adopt.
A manual likes-plus-comments worksheet may therefore differ from a displayed vendor score without either calculation being wrong. Check the formula, observation period and eligible content before investigating arithmetic. Keep the vendor score in its original field and label your own measure separately. A comparison becomes misleading when an analyst renames several different calculations “ER” and sorts them as though they describe the same thing.
Distinguish typical posts from pooled performance
For three hypothetical post rates of one, two and twelve percent, the simple mean is five percent while the median is two. Pooling interactions and dividing by pooled views creates a different, view-weighted calculation. Those operations answer different questions even when every input comes from the same creator.
For typical content, inspect the median and variability. For the total observed campaign response, a clearly defined pooled rate may be useful. Retain the source rows so a teammate can reconstruct the result. Do not remove an outlier simply because it is inconvenient; identify whether it represents paid amplification, a giveaway or a relevant content success before deciding how it belongs in the sample.
Keep unavailable values out of invented precision
Hidden likes, unavailable saves and unauthorized native analytics are missing information, not confirmed zeros. If the calculation uses public likes and comments only, name it a public-interaction measure. A smaller but consistently defined dataset can be more useful than a precise-looking percentage built from guessed values.
Compare similar formats, periods and sample conditions. Without a representative dataset, avoid publishing a universal pass line for every industry. Internal history also needs sample size and inclusion rules. A brand with five completed posts has operating observations, not an industry benchmark. The metric-definition guide can help the team maintain a common dictionary as more campaigns are added.
Connect the percentage to the partnership decision
A high rate may accompany a giveaway, controversy or an audience outside the serviceable market. Inspect the conversation, audience relevance, product explanation and next action before deciding the content is commercially useful. A metric can be associated with an outcome without demonstrating that it caused it.
Pricing still depends on deliverables and rights. Conversion analysis needs deduplicated orders and full cost. QuickKOL can assist content understanding and candidate reasoning, but a defensible decision retains provenance and unknowns. Use the calculator article for arithmetic and the Instagram worksheet for platform-specific public data. This article’s purpose is choosing an interpretable measure before either of those steps.
Worked example: why one asset can have two engagement rates
Suppose an asset receives six hundred likes and forty comments. The account has twenty thousand followers, and the asset has ten thousand views. With only likes and comments included, the numerator is 640. Dividing by followers gives 3.2%; dividing by views gives 6.4%. Both calculations can be arithmetically correct while describing different relationships.
The higher percentage does not show that performance improved. Only the denominator changed. If another report includes saves and shares, its numerator also differs. If it uses the account’s current followers rather than a count captured at publication, timing may differ too. Write those choices into the metric label and retain the underlying values.
For a comparison, choose one definition and apply it consistently to a relevant group. When a required input is unavailable, show the limitation rather than forcing a percentage into the table. This example is hypothetical and does not represent a platform benchmark. Its purpose is to explain why the first analytical question should be “what was divided by what?” before anyone decides whether a result is high, low or better than another creator’s.
FAQ: should you average engagement rates across posts?
A simple average of post-level rates, a ratio of summed interactions to summed denominators and a median are different summaries. Choose the method according to the question. Are you describing a typical post, the combined observed volume or a distribution that contains unusual values? There is no reason to label all three as the same statistic.
A low-volume post with a high percentage can influence a simple average much more than its contribution to a pooled ratio. A median can resist an extreme value while hiding important variation. None of these choices fixes a sample containing incompatible denominators or mixed formats. Review the input group before discussing the summary.
Retain post-level values, the inclusion rule and the observation window so another analyst can reproduce the result. If a creator has too few comparable posts, say so instead of assigning a precise quality score. Engagement rate is a descriptive measure of the chosen inputs, not a complete model of content value, audience honesty or commercial return. That boundary should remain visible when the number is copied into a shortlist or buying presentation.
Research date, evidence and limitations
Reviewed October 21, 2026. Rates are arithmetic from hypothetical inputs. Vendor formulas reflect documentation checked on that date and may change.
Three denominators, three questions
Editorial analysis and labeled hypothetical examples, not performance rankings, quotes or guarantees.
| Denominator | Question | Limit |
|---|---|---|
| Followers | Response relative to account size | Not the people exposed |
| Views | Response relative to recorded views | May include repeated views |
| Reach | Response relative to unique accounts | Needs matched asset and window |
CHECKLIST
Before you put this into practice
Record the answers in the campaign working file.
- Define numerator and denominator
- Label mean, median or pooling
- Do not replace missing with zero
- Do not infer sales from a percentage alone
Sources and further reading
External pages can change. Recheck platform rules, contracts and local law before launch.