
THE SHORT ANSWER
This engagement rate calculator adds the likes, comments, saves and shares you enter, then divides the total separately by followers and views and multiplies by one hundred. It calculates supplied data; it does not fetch an account, verify authenticity, forecast performance or rank a creator. Use one asset and one observation window. Leave unavailable data blank. If your reporting excludes an interaction type, declare that narrower numerator rather than presenting the result as complete native engagement.
Prepare a matched dataset
Record the content link, capture date, follower count, views and each included interaction type. State whether follower count was captured at publication or review. If historical scale is unavailable, keep that limitation rather than reconstructing an invented history from today’s profile.
Do not combine an early screenshot of views with a later count of interactions without explanation. Content can continue accumulating activity. Preserve the original report or screenshot with its timestamp before entering numbers. The calculator cannot diagnose mismatched windows from arithmetic alone. A dataset with clear provenance is the foundation of a useful result, even when the underlying calculation is simple.
Reproduce the default example by hand
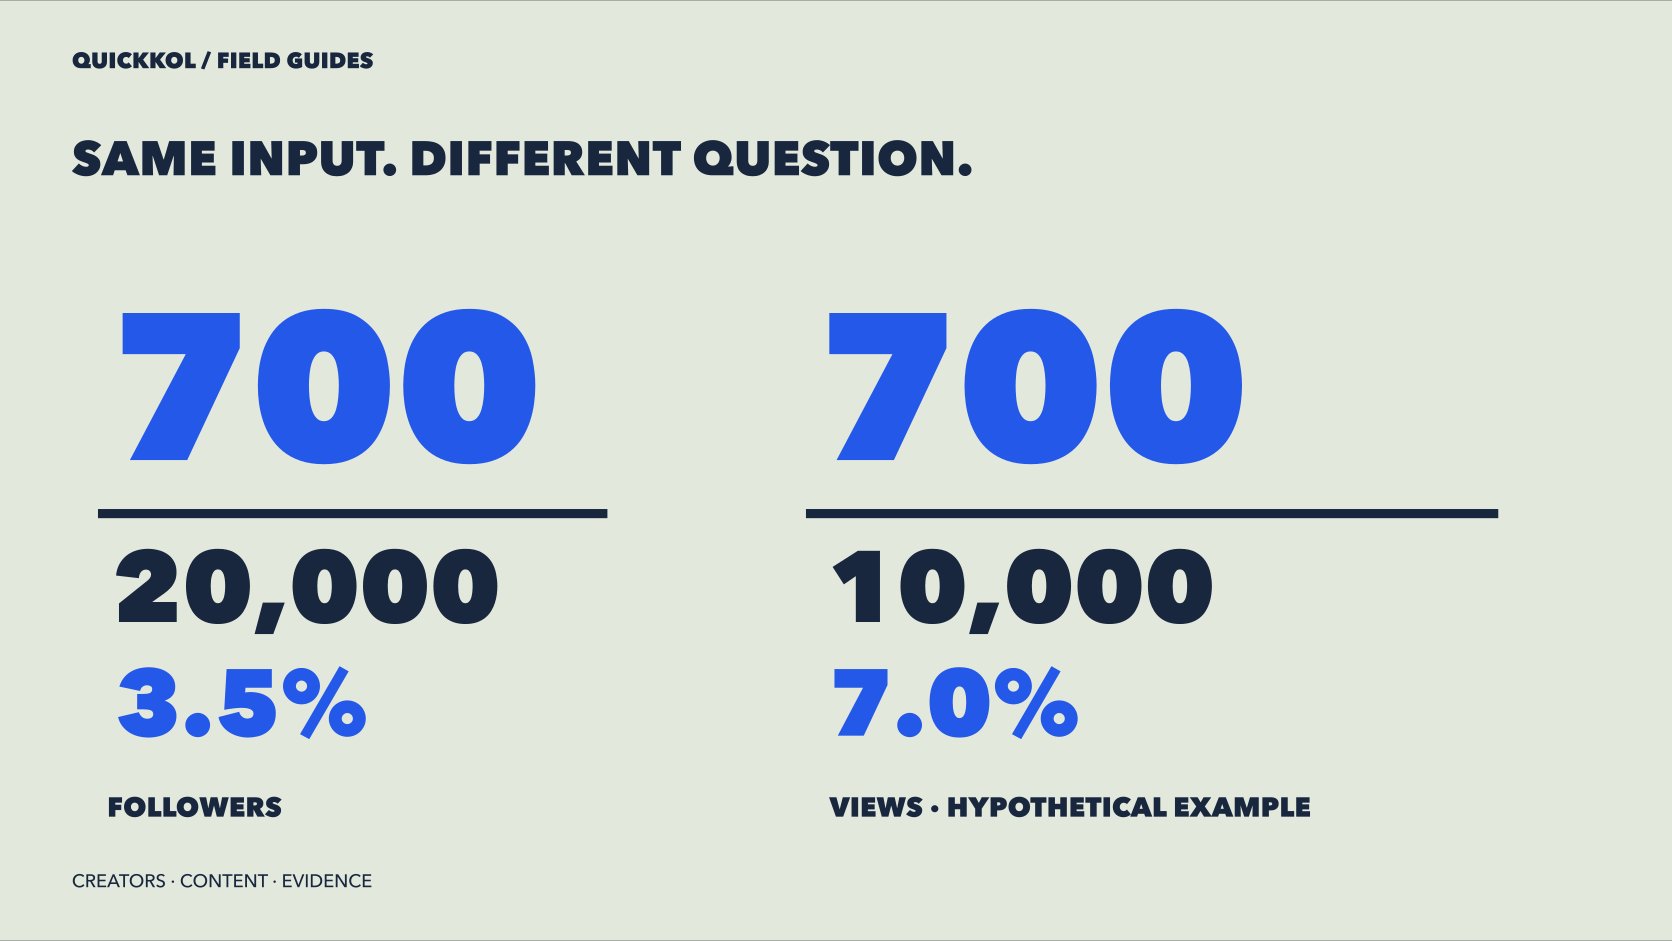
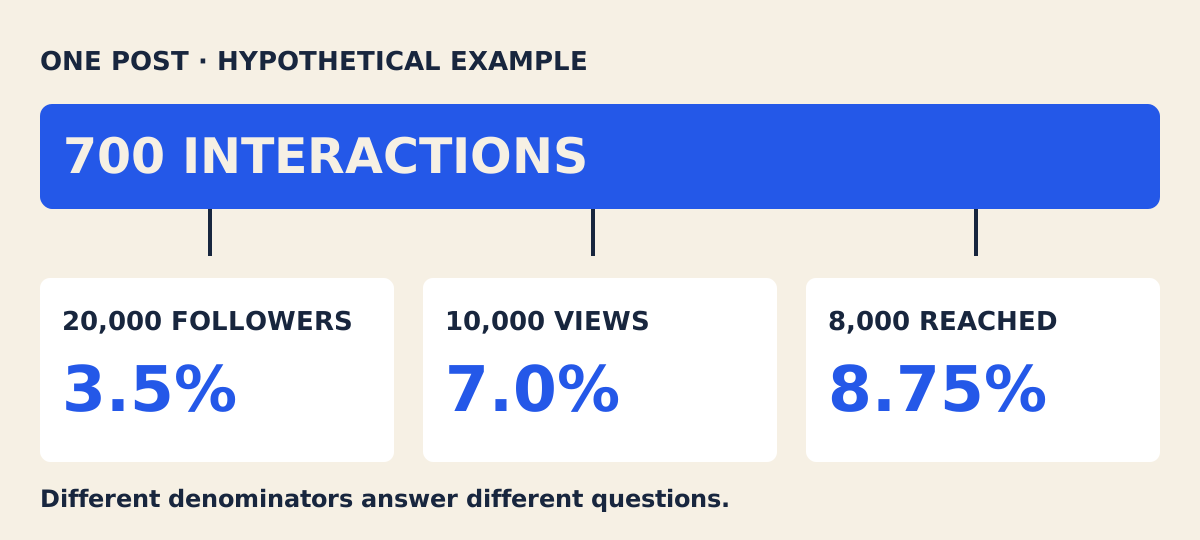
The default example contains six hundred likes, forty comments, thirty saves and thirty shares: seven hundred interactions. Dividing by twenty thousand followers gives 3.5%; dividing by ten thousand views gives seven percent. Changing the denominator changes the percentage, not the interaction total.
These are illustrative inputs, not average performance. Two-decimal display is a presentation choice, not additional evidence quality. Keep the unrounded inputs and formula in the working record. A simple hand calculation helps catch a pasted count in thousands, a missing zero or an analyst who copied the displayed percentage instead of the original interaction count.
Distinguish zero, blank and excluded metrics
Blank means unavailable and should prevent a complete-dataset calculation. Enter zero only for a confirmed zero. A zero denominator cannot produce a valid rate and is shown as unavailable. A follower-based result may still exist when views are zero, but that does not make the view-based measure interpretable.
For a deliberately likes-plus-comments scope, use the Instagram public-data worksheet rather than silently setting unknown saves to zero. Exclusion is a methodological choice; missing data is an evidence limitation. Record which one applies. The difference matters when a colleague later compares the result with another report containing a broader set of interactions.
Do not rename the result as a vendor score
Modash documents platform-specific engagement methods. The total-entered-interactions formula here can differ from a score displayed in that product. This calculator represents only the formula stated on this page.
Use labels such as “entered interactions divided by views” in the report. If a stakeholder requires a different definition, align the data and description first. Renaming the result does not align methodologies. Keep the original vendor output for reference and calculate the brand’s reporting measure in a separate field. That small distinction prevents a later analyst from treating a manual worksheet, native report and estimated database score as interchangeable observations.
Choose an aggregation rule before combining posts
Suppose two posts have one hundred interactions from one thousand views and one hundred from ten thousand views. Their individual rates are ten and one percent. The simple average is 5.5%, while the pooled result is two hundred divided by eleven thousand, approximately 1.82%.
The average describes the mean post rate; the pooled measure relates combined interactions to combined views. Neither should be mislabeled as the other. Do not sum the same account’s follower count once per post and call the result a unique campaign audience. For a portfolio decision, retain individual rows, indicate repeated creators and explain the chosen aggregation before comparing campaign totals.
Use the output as an input to a decision
Use the output to understand response alongside comment themes, audience relevance and observed scale. An unusually high percentage can reflect a small denominator. It does not guarantee efficient paid distribution or a commercially meaningful number of people.
Do not multiply engagement rate by product price to forecast sales. Conversion reporting needs a defined path, orders and costs. The conversion-tracking guide covers that next step. QuickKOL can help organize content reasoning and outreach preparation, but no single formula replaces partnership review. Save the calculation with its source and decision question so it remains useful after the attractive percentage has been copied into a presentation.
Worked example: audit units and timestamps before entering a report
Suppose a report labels followers as 20K, supplies an interaction screenshot from Monday and a view count from Friday. Before typing anything, convert the unit to the actual count and obtain values from a compatible observation window. Entering twenty as though it meant twenty thousand produces a valid arithmetic operation on the wrong scale. Combining unmatched dates can create a different error that the calculator cannot identify.
Keep the original material and transformation notes. If a required value cannot be obtained, use a separately defined measure supported by available evidence or leave the calculation incomplete. Do not fill an unknown component with zero merely to unlock the result. The narrower Instagram worksheet is appropriate when the intended definition explicitly includes only likes and comments.
Ask a second person to reproduce the calculation from the working record without verbal instructions. If their result differs, inspect units, included interactions and denominators before discussing performance. This review tests whether the report is usable, not only whether the interface returns a number. The calculator cannot authenticate screenshots, establish sample representativeness or judge commercial fit. Its value is making the arithmetic transparent once the evidence and definition have been aligned.
FAQ: why is there no percentage for a zero denominator?
A zero denominator makes the ratio undefined. It should not be presented as zero engagement, infinite performance or an automatic pass. Check whether the asset has not yet accumulated the relevant observation, whether the field is missing or whether the wrong population was selected. A blank input and an observed zero also mean different things.
Another common question is whether interactions equal unique participating people. They do not necessarily. One person can perform more than one action, so a sum of likes, comments, saves and shares is an event total under the selected definition. It is not automatically a count of distinct people. A percentage based on that total should not be rewritten as the share of unique users who engaged.
If the business question needs unique participants, request an appropriate authorized measure and document its scope. Do not reverse-engineer it from an interaction sum. The calculator deliberately keeps arithmetic visible so these questions can be answered before the figure becomes a benchmark or a campaign promise. A useful calculation is one the next reviewer can explain as well as reproduce.
Research date, evidence and limitations
Reviewed October 21, 2026. The worksheet reuses the site’s existing calculation logic. Defaults are hypothetical and connect to no account or platform dashboard.
Checks before and after calculation
Editorial analysis and labeled hypothetical examples, not performance rankings, quotes or guarantees.
| Error | Effect | Correction |
|---|---|---|
| Treating K as a raw count | Rate off by a thousandfold | Enter actual counts |
| Replacing missing with zero | Understated, falsely complete numerator | Obtain evidence or declare exclusion |
| Calling a mean pooled | Changes interpretation | State aggregation formula |
PRACTICAL TOOL
Two denominators for the same content
Use one post and one observation window. Leave unavailable data blank; zero means a confirmed zero. Views are not unique reach.
Sources and further reading
External pages can change. Recheck platform rules, contracts and local law before launch.