
THE SHORT ANSWER
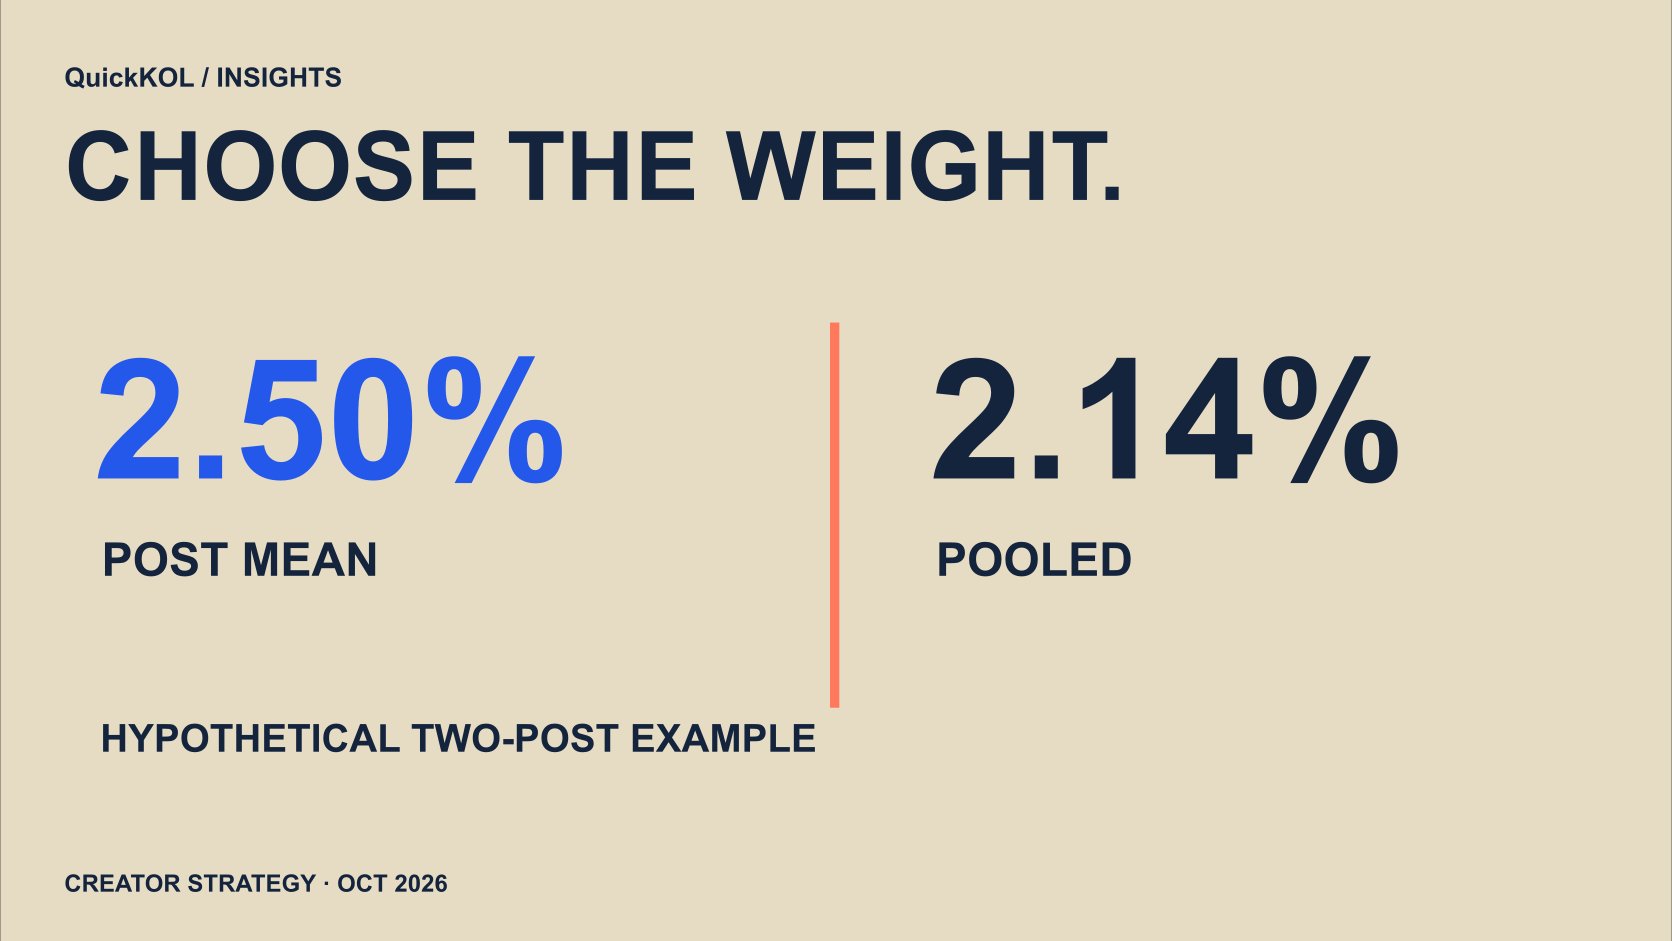
Calculate public likes plus comments against each post’s follower base, then choose a simple post average or a pooled numerator-over-denominator ratio. The first gives each post equal weight; the second weights by denominator size. Summed follower bases are not unique audience reach. This calculator compares the arithmetic for two posts and fetches no account data. All defaults are hypothetical. It complements the single-post worksheet by addressing aggregation rather than offering another unexplained engagement score.
Define the aggregation unit
A post, a creator and a campaign are different analytical units. Decide whether the question concerns a typical post or the ratio formed by combining a defined set of numerators and denominators. Do not choose the more flattering summary only after calculating both.
Keep each post URL, capture date, interaction count and corresponding follower base. Several posts from one account still need separate rows. The denominator guide explains the underlying choice. Retaining the rows lets another reviewer reconstruct the result and see whether the summary describes one creator repeatedly, several creators with very different sizes or a mixed set whose aggregation may be inappropriate for the decision the brand wants to make.
Recalculate the defaults
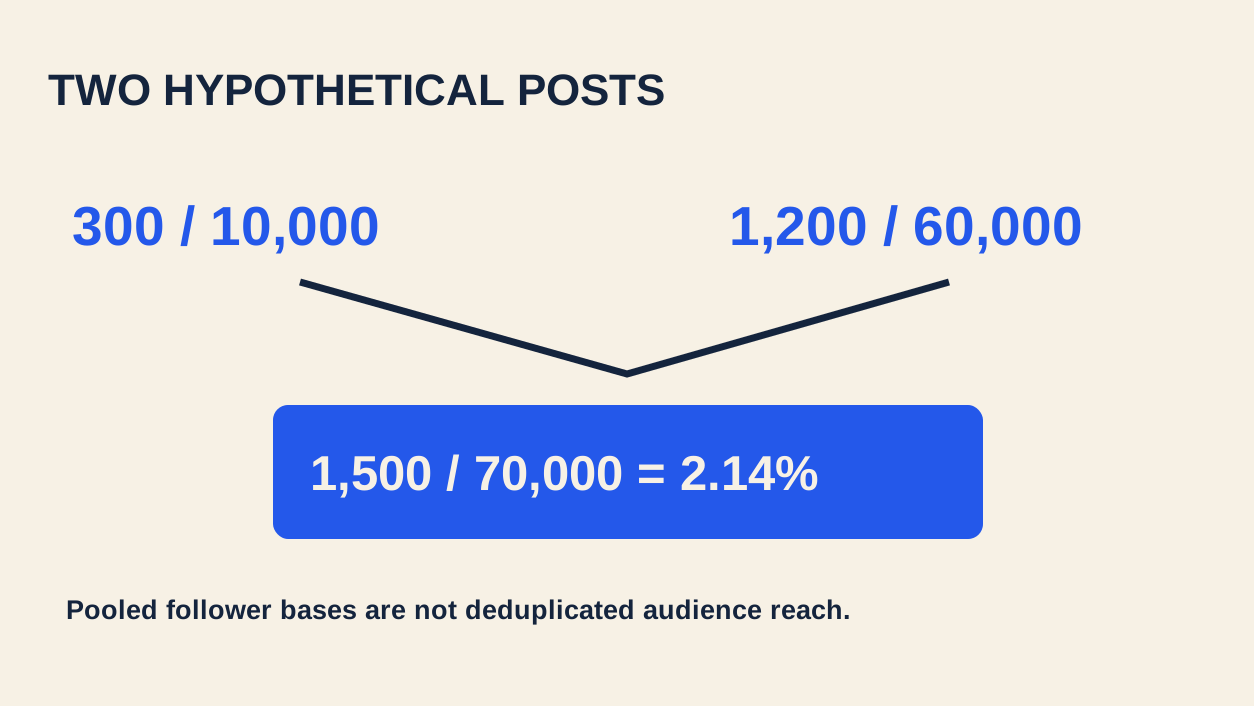
Post A has a hypothetical three hundred interactions against ten thousand followers, producing three percent. Post B has twelve hundred against sixty thousand, producing two percent. The simple average is 2.5 percent. Pooling produces fifteen hundred divided by seventy thousand, or approximately 2.14 percent.
B has more influence on the pooled result because its denominator is larger. That is a weighting effect, not evidence that B is more valuable or higher quality. The worksheet displays both summaries so the distinction remains visible. Neither default is a normal-performance threshold. Replace the inputs with comparable observations and retain the formula label rather than allowing the first displayed percentage to become a target for every future campaign.
Choose the summary for the question
A simple mean can be useful when each post should contribute equally to the description. A pooled ratio can be useful when the question concerns the relationship between the combined defined counts. Neither is inherently an error, but they should not share an ambiguous average-engagement label.
Two posts cannot establish a category benchmark. With a larger suitable sample, median and variability may help describe typical content, but those summaries also need a stated purpose. The performance-benchmark guide develops comparable groups. Keep the reporting choice tied to the question so an analyst cannot switch between mean, median and pooling merely because one produces the preferred impression of a partner or campaign.
Summed follower bases are not deduplicated reach
The same person may follow both creators or encounter several posts from one account. Summing follower bases creates a denominator for this post-level calculation, not seventy thousand unique viewers. Label it accordingly in the report.
If the question concerns unique reach, obtain an appropriate deduplicated source. This formula cannot derive it. Interactions can also include several actions from one person, so the numerator is not a count of distinct engaged people. The metric-definition guide helps preserve those units. A mathematically correct ratio can still mislead when its denominator is renamed in a presentation, particularly if a client interprets combined account scale as the number of people who definitely saw or acted on the campaign.
Pool only compatible numerators
This worksheet uses public likes plus comments. Do not pool that numerator for A with a native likes-comments-saves-shares total for B. Unavailable saves should not be entered as zero to make the datasets appear complete. Choose a compatible narrower set or report the incompatibility.
Modash documents its own Instagram method using median likes relative to followers. That is different from this worksheet. Compare formulas, sample scope and dates before comparing results. The single-post worksheet develops public-data limitations. Aggregation does not remove those limitations; it can hide them more effectively if the final report retains only one percentage and drops the source definitions that made the original observations interpretable.
Align time and format
Use the same post-publication window and distinguish Reels, images, giveaways and paid amplification. A newly published observation and a long-running total should not be pooled and described as performance at the same stage. Keep the format and inclusion rule visible.
If the follower base at publication is unavailable, explain that the capture-date snapshot is being used. Do not silently describe a current count as an exact historical value, especially when the account changed substantially. The follower-change log helps maintain dated observations. A transparent approximation can be usable for a limited internal question, while an undocumented substitution can make later comparisons look more precise than the evidence supports.
Understand zeros and blanks
The calculator pauses when a field is blank because the dataset is incomplete. If either post denominator is zero, that post’s rate is unavailable and the tool does not pretend the other post represents a complete two-post result. Zero interactions with a positive denominator, however, can legitimately produce a zero rate.
This is a conservative worksheet rule, not a judgment that missing content has no value. Obtain the missing evidence or explicitly narrow the reporting scope before calculating. The original rows should remain visible in the working file. Handling absence honestly is preferable to producing a precise-looking campaign number that conceals the exclusion most likely to change how the result is understood.
As a useful cross-check, equal denominators make the simple mean and pooled ratio identical. Change only the second denominator in the worksheet to see the weighting effect. This checks the arithmetic without suggesting that equal account sizes make the underlying audiences or content comparable.
Use the summary to ask the next question
Report absolute interactions, sample size, window and completion of the content task beside the ratio. A high percentage does not independently prove orders, and a low one does not automatically establish delivery failure. The next question should follow the campaign objective rather than the direction of the percentage alone.
QuickKOL can support content understanding and candidate reasoning. The arithmetic still needs connection to the actual project evidence. Save the complete worksheet so a later comparison can be reviewed instead of preserving 2.14 percent as an unexplained label. A useful aggregation makes the tradeoff between units and weights visible, allowing a teammate to choose the summary appropriate to the decision without reconstructing the calculation from memory.
Research date, evidence and limitations
Sources reviewed October 21–22, 2026. Workflows are editorial recommendations and numerical examples are hypothetical, not observed campaign results, creator rankings or offers.
Two hypothetical posts, two summaries
Editorial analysis and labeled hypothetical examples, not performance rankings, quotes or guarantees.
| Method | Result | Meaning |
|---|---|---|
| A | 3.00% | 300 / 10,000 |
| B | 2.00% | 1,200 / 60,000 |
| Simple mean | 2.50% | Equal post weight |
| Pooled ratio | 2.14% | Denominator weighted; not deduplicated |
PRACTICAL TOOL
Two-post Instagram aggregation worksheet
Defaults are hypothetical. Use consistent definitions and windows; leave unknowns blank and enter zero only when confirmed. This tool fetches no accounts.
Sources and further reading
External pages can change. Recheck platform rules, contracts and local law before launch.