
THE SHORT ANSWER
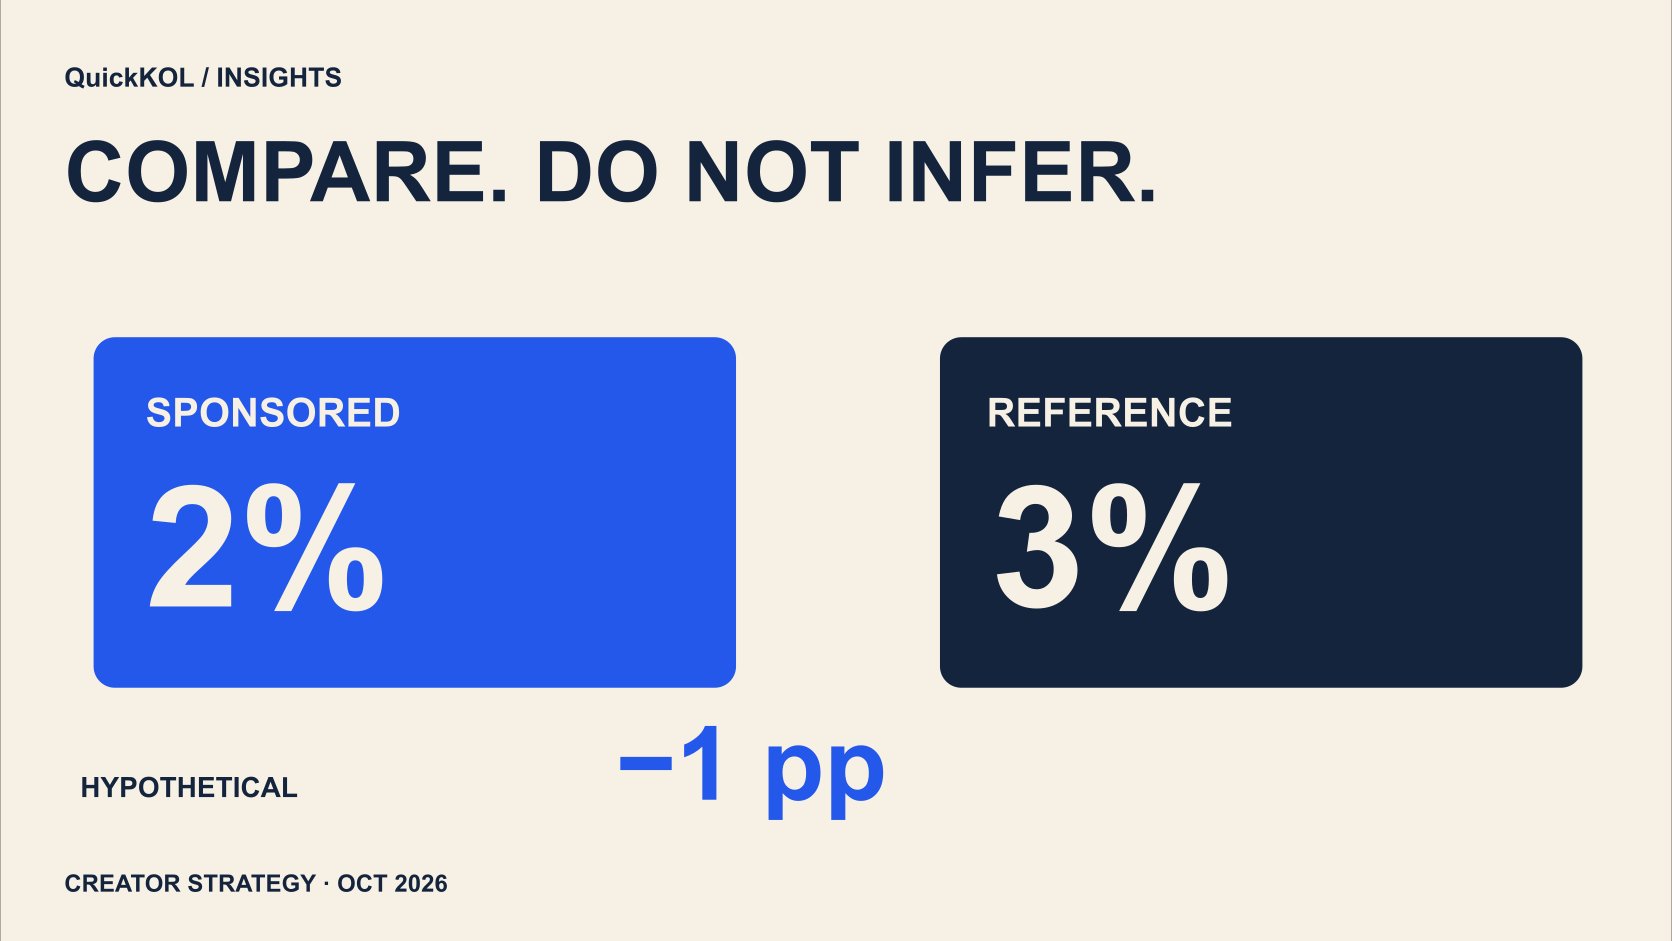
This Instagram engagement rate calculator compares public likes plus comments relative to followers for one sponsored post and one matched reference. It reports each rate, the percentage-point difference and their ratio. Hypothetical defaults produce two versus three percent, a minus-one-percentage-point difference and a rate ratio near 0.67. This is a descriptive comparison, not proof that sponsorship caused a decline or a substitute for a carefully constructed historical baseline.
Define the reference
One ordinary post, a median across matched posts and a historical campaign average are different references. This worksheet accepts counts for one reference observation. Do not insert an arbitrary multi-post average and describe it as a real post without explaining the construction.
Choose the comparison question and inclusion rule before selecting the reference. Avoid finding the best or worst historical post merely to make sponsored performance look favorable. The performance-benchmark guide develops reference groups. A one-post comparison can help inspect arithmetic or prepare a review question, but its evidence is limited. The label matched reference should describe the checks actually performed, not imply a formal counterfactual that a simple worksheet cannot establish.
Recalculate the defaults and units
Four hundred divided by twenty thousand produces two percent. Six hundred divided by twenty thousand produces three percent. Subtracting gives minus one percentage point, not a one-percent decline. Dividing two percent by three percent gives a rate ratio near 0.67, equivalent to a relative change near minus 33.33 percent. All inputs are hypothetical.
Percentage points and relative percentage change are different units. Preserve both original rates so a relative change does not turn a small absolute difference into an exaggerated headline. The denominator guide explains the underlying measures. The calculator displays the ratio and point difference together to make the descriptive arithmetic easier to inspect without choosing whichever expression sounds most dramatic.
Match format, timing and subject
The same account does not make two posts comparable. A Reel and carousel, promotional and everyday subjects, or a holiday and ordinary week can produce different observation conditions. Match format and post-publication window where possible and retain remaining differences.
Check paid amplification, giveaways and pinned placement. If differences cannot be removed, keep them in the interpretation rather than hiding them behind the baseline label. The Instagram campaign guide helps identify format and distribution decisions. Matching improves the relevance of a descriptive comparison, but it does not remove every other explanation. A reviewer should be able to see why the reference was chosen and which factors still prevent the observed gap from being treated as a sponsorship effect.
Do not mix public counts with vendor scores
Both sides of this worksheet use likes plus comments. Modash documents its own Instagram definition using median likes relative to followers. Its score should not be inserted as though it were this worksheet’s reference interaction count. The unit and aggregation differ.
If authorized native saves and shares become available, create another comparison with a consistent numerator on both sides. Preserve the original public-data record rather than rewriting it silently. The single-post worksheet develops these source boundaries. A vendor result can be useful in its own context, but it becomes misleading when its label disappears and a reader assumes it was produced by the same formula, sample and date as the other side of the comparison.
Handle zero and missing data explicitly
If either follower denominator is zero, the corresponding rate is unavailable. If reference interactions are confirmed zero with a positive follower base, its rate is zero, but the sponsored-to-reference ratio is undefined. The percentage-point difference can still be reported. The tool distinguishes these states.
A blank means missing, not zero. Zero interactions also do not automatically establish delivery failure, especially with a short window. Keep the observation conditions alongside the result. An honest unavailable value is more informative than an infinite multiplier or a fabricated percentage created by replacing the denominator with a small arbitrary number. The calculation should expose the limitation rather than conceal it to keep every result tile populated.
A difference is not a causal effect
A sponsored post can differ in subject, publication timing and recommendation distribution. Even careful matching does not automatically establish what would have happened without sponsorship. A single observational reference leaves several possible explanations for the gap.
A stronger causal question needs an appropriate comparison or experiment. The incrementality guide explains that evidence requirement in campaign evaluation. Do not use this calculator to claim sponsored content necessarily performs worse or that adding a product will improve a rate by a predictable amount. The descriptive result can identify a question worth examining, but the conclusion should remain proportionate to the design. A precise ratio is not a substitute for a credible counterfactual.
Use the comparison for creative diagnosis
If the sponsored rate is lower, inspect product integration, opening, explanation and next action. Also check whether the reference benefited from an unusual event. Form a testable creative hypothesis before turning the difference into a judgment about the creator.
For a next cycle, the team might change only the opening structure while keeping other conditions as comparable as practical. Changing product, offer and distribution simultaneously makes interpretation harder. The creative-test guide helps structure this learning. A comparison is useful when it produces a focused next question, such as whether viewers understood the demonstration, rather than a general demand to make the next post more engaging without identifying what the brand intends to improve.
When follower bases come from different dates, retain both capture times. A changed denominator can affect the comparison even if interaction counts are similar. State that limitation rather than attributing the entire gap to the sponsored creative or the presence of the product.
Keep both observations and the decision
Report both URLs, dates, formats, definitions, results and limitations. Preserve the decision: continue, revise the task or obtain more evidence. A rate ratio of 0.67 without its two observations quickly becomes an unexplained label that future teammates cannot evaluate.
QuickKOL can support content understanding and communication preparation. The calculator itself fetches no Instagram data and certifies no account quality. Its value is making obtained evidence easier to inspect and explain. Keep that narrow purpose visible when sharing the result, especially if someone intends to use the comparison in a renewal or pricing conversation where the precision of the arithmetic can otherwise be mistaken for certainty about the cause.
Research date, evidence and limitations
Sources reviewed October 21–22, 2026. Workflows are editorial recommendations and numerical examples are hypothetical, not observed campaign results, creator rankings or offers.
Units in the hypothetical comparison
Editorial analysis and labeled hypothetical examples, not performance rankings, quotes or guarantees.
| Output | Default result | Limitation |
|---|---|---|
| Sponsored / reference rates | 2% / 3% | Public likes and comments |
| Percentage-point difference | −1.00 pp | Not −1% relative change |
| Rate ratio | 0.67× | Descriptive; not causal |
PRACTICAL TOOL
Sponsored post versus one matched reference
Defaults are hypothetical. Use consistent definitions and windows; leave unknowns blank and enter zero only when confirmed. This tool fetches no accounts.
Sources and further reading
External pages can change. Recheck platform rules, contracts and local law before launch.