
THE SHORT ANSWER
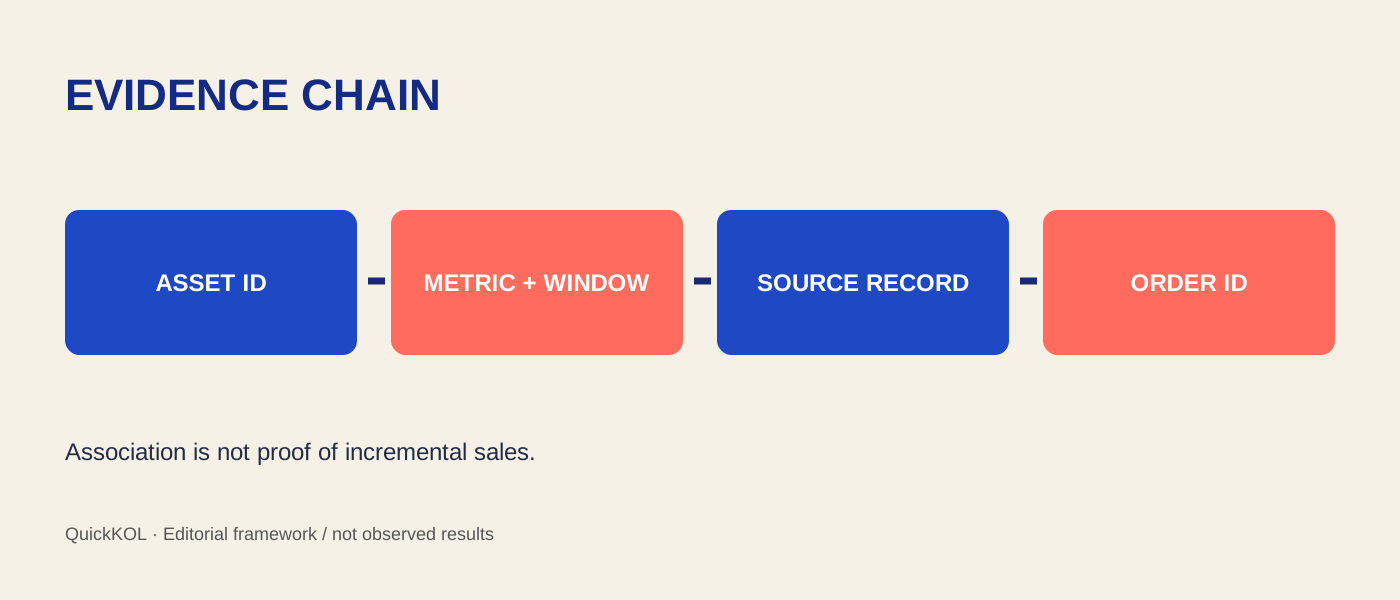
Evaluate influencer campaign analytics through a traceable evidence chain, not the presence of three attractive charts. A useful system can explain which asset produced an engagement number, where a reach figure came from and how a conversion was associated with the campaign. It also preserves the places where those relationships are unavailable. Bring a small acceptance dataset to the demonstration and ask the vendor to process the same cases your team will encounter after launch.
Start with a fixed acceptance dataset
Prepare a small anonymized dataset before the demo: two creators, three assets, one unavailable post, one username change and a purchase event submitted twice. Give each record an identifier, timestamp and expected treatment. Use invented customer information or no customer information at all; an acceptance exercise does not require exposing real buyers.
Write the expected result in a simple worksheet first. Otherwise a persuasive interface can quietly define what the team considers correct. Ask the vendor to import the records, explain the transformations and export the result. Keep the sales presentation separate from your test notes. The aim is to discover how the product handles ordinary exceptions, including cases where an analyst must intervene, rather than prove that every field can be filled automatically.
Preserve engagement components
Ask for the numerator, denominator, content scope and reporting window behind each engagement field. A percentage without these components cannot be meaningfully compared across assets. Likes per follower, interactions per view and engaged accounts per reached account answer different questions. Actions also need not represent distinct people.
Change one denominator in the test dataset and remove a visible like count. Observe whether the system returns unavailable, estimated or zero. These states should remain distinguishable in both the interface and export. Then ask how an analyst can annotate the change. The metric-definitions guide provides the vocabulary for this conversation. A reporting product passes this part of the test when another teammate can reconstruct the calculation without asking the original operator what a conveniently named field was supposed to mean.
Test reach at its actual deduplication boundary
Suppose two posts report reach of 8,000 and 6,000 accounts. Adding them produces 14,000 post-level reached-account counts, not necessarily 14,000 distinct campaign viewers. Some people may have seen both. The same issue applies across creators, paid amplification and repeated reporting windows. These numbers are hypothetical and illustrate a naming problem rather than a performance benchmark.
Ask the vendor to identify the exact boundary within which its source deduplicates people. Keep the source value alongside any derived total. If cross-post deduplication is unavailable, the dashboard should label the result as summed reach or leave unique campaign reach unavailable. An estimated value can be useful when its method is disclosed, but it should not silently overwrite an observed figure. Acceptance means preserving the distinction when the chart is copied into a presentation.
Inspect conversion identifiers
Google Analytics documents campaign URL parameters for identifying referred traffic. Those parameters do not establish that a purchase would not have happened without the creator. Test the mapping between creator, asset, destination and campaign tags, including the effect of a redirect or an incorrectly reused link.
Ask the system to show the evidence behind an associated purchase. A link attribution, discount-code use and customer survey answer are different observations; summing them can count one order several times. Reconcile against the order system, including currency, refunds and the chosen time window. The conversion-tracking guide covers implementation details. For procurement, the decisive question is whether the analyst can inspect and correct the relationship, rather than accept a total called revenue that conceals several incompatible association rules.
Test duplicates and late arrivals
Google Analytics describes transaction-ID deduplication for web streams, with an explicit distinction from app streams. That source-specific behavior should not be generalized to every database in a reporting stack. Submit the same test purchase twice and verify what the campaign dashboard actually does with the duplicate.
Next, submit a refund after the daily report has been exported. Check whether historical totals change, whether the revision is dated and whether the original export remains identifiable. A live window and a frozen report serve different purposes. Ask who owns reconciliation when the commerce system and dashboard disagree. A documented limitation is preferable to a silent correction that leaves finance, marketing and the creator discussing different versions of the same campaign outcome. Retain both the test inputs and the observed outputs.
Make missing data reportable
Unavailable posts, hidden metrics, expired authorization and failed collection can all create gaps. Ask for a reason code and the last successful observation time. The export should distinguish not obtained from confirmed absent. A blank cell must not automatically become zero simply because a chart expects a number.
If eight of ten assets have usable data, the report should name that coverage. It should not imply that all ten were fully evaluated. Test how incomplete records affect averages, rankings and campaign totals. Also check whether a manual entry is labeled with its author and supporting file. These controls matter when teams compare creators with different data access. A feature list may promise comprehensive analytics, but your acceptance record should state the actual coverage achieved with the evidence routes your campaign can use.
Turn the test into a purchase condition
Record each test as passed, supported with a manual step or unsupported. Include the owner and time required for any workaround. If deduplication happens in a separate spreadsheet, that spreadsheet is part of the real operating cost. A weighted total can hide a critical failure, so preserve the individual decisions and the minimum conditions for purchase.
Use the metric-definitions guide and conversion-tracking guide to turn unclear fields into precise questions. Ask for a repeat demonstration of unresolved critical cases before committing to a broader rollout. QuickKOL can support the earlier work of understanding a brief and researching creators; suitability of an analytics system still depends on these observed tests. The final deliverable is an acceptance record the next analyst can repeat with the same inputs, definitions and expected exceptions.
Which failures should block purchase?
Use predefined gates for failures such as untraceable critical metrics, unresolved duplicate orders or an unsupported required source. A noncritical chart issue can remain an improvement request. A sales promise should not replace observed acceptance. Record which failure blocks the purchase and which can be managed through a named, costed manual step.
Research date, evidence and limitations
Sources reviewed October 23, 2026. Workflows are editorial recommendations. All worked examples are hypothetical, not client results, creator rankings or quotations.
A decision sheet for this assignment
Editorial analysis and labeled hypothetical examples, not performance rankings, quotes or guarantees.
| Condition | Evidence | Decision |
|---|---|---|
| Engagement | Components, denominator, window | Reconstruct the ratio |
| Reach | Source deduplication boundary | Do not rename sums as unique people |
| Conversion | Order ID and association rule | Test duplicates and refunds |
CHECKLIST
Before you put this into practice
Record the answers in the campaign working file.
- Prepare expected outputs
- Export missing-data reasons
- Cost manual steps
- Keep critical failures visible
Sources and further reading
External pages can change. Recheck platform rules, contracts and local law before launch.