
QUICKKOL / INSIGHTS
Audience & Analytics
Interpret creator audience, engagement and viewing data, spot anomalies and choose metrics that fit your campaign.
Start here: How to analyze creator data beyond engagement rate
Showing 73–84 of 151 matching articles · 632 published.

Twitch Statistics: Read the Sponsored Stream Window
Distinguish average concurrent viewers, unique viewers and the actual sponsor window in Twitch reporting.
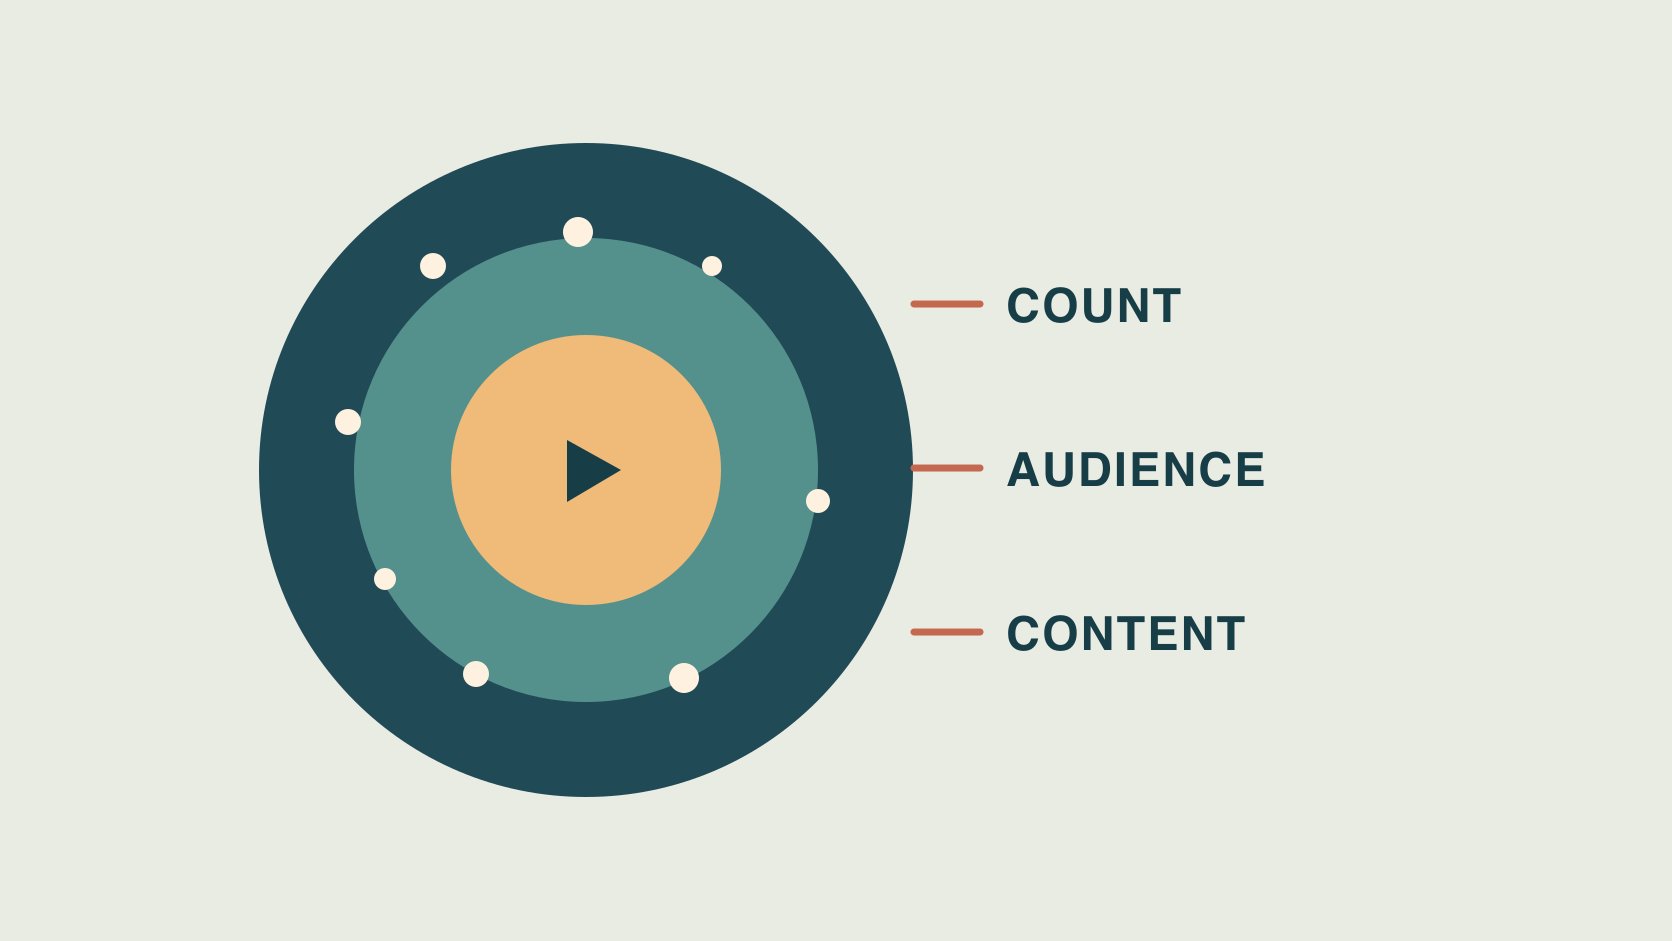
TikTok Followers: Use Counts With Audience Evidence
Use TikTok follower snapshots for account scale and verify market fit, content response and pilot delivery separately.
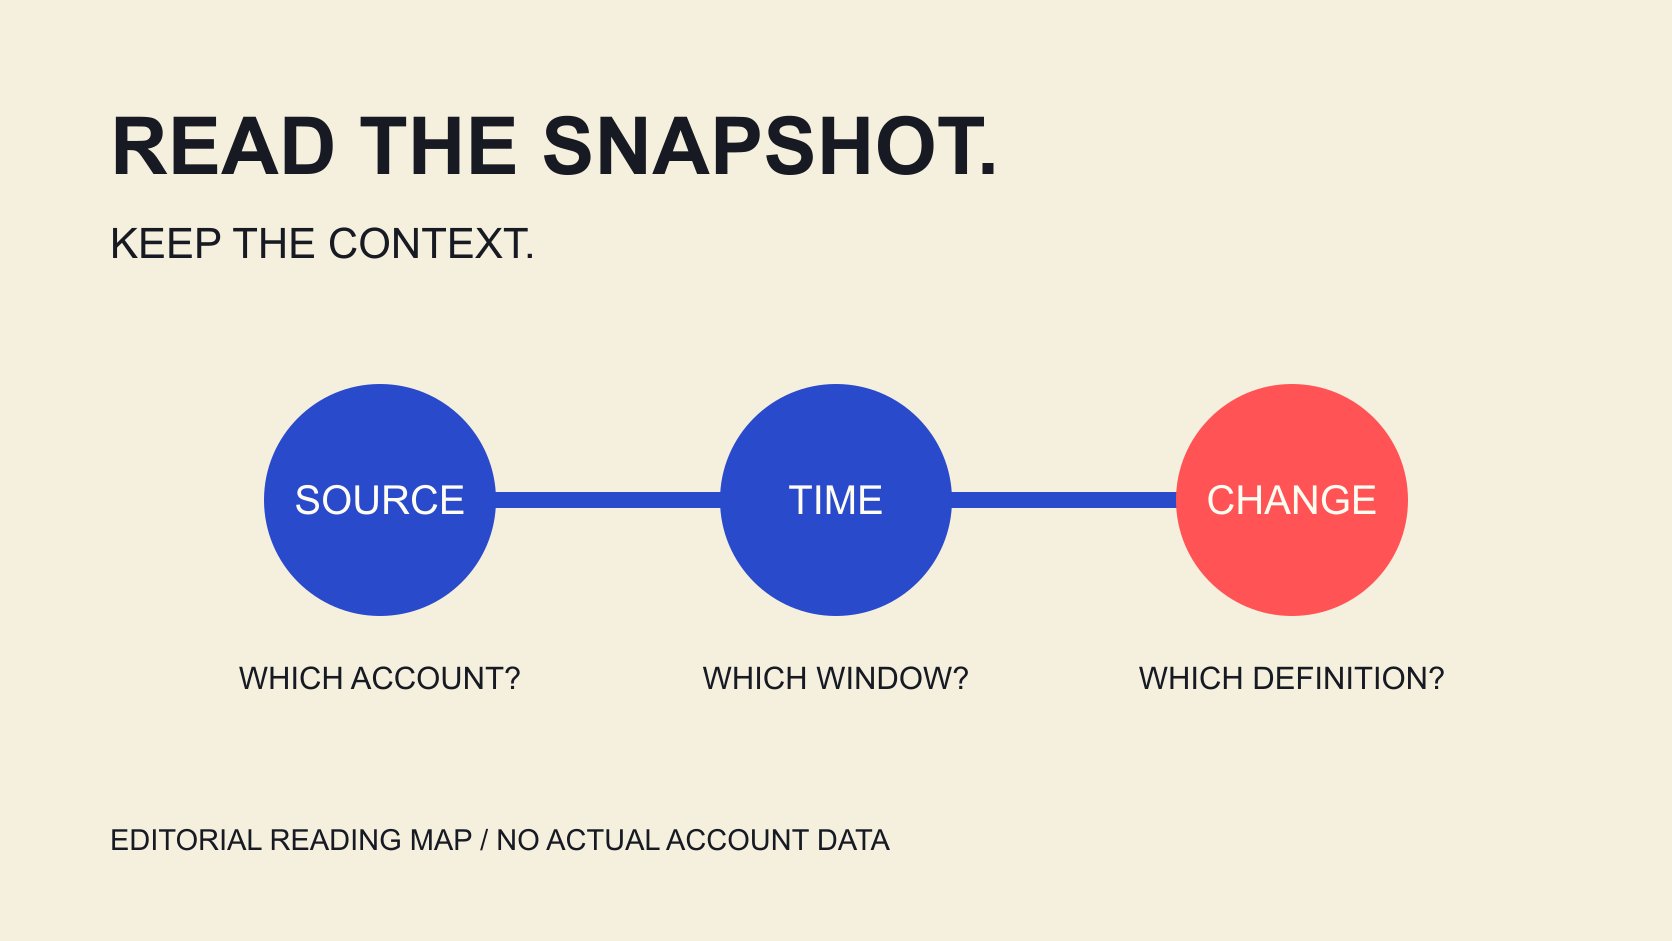
Social Blade: Read Public Channel Statistics
Read Social Blade public channel statistics by confirming identity and window, then interpreting changes, update differences and estimated earnings without treating snapshots as complete analytics.
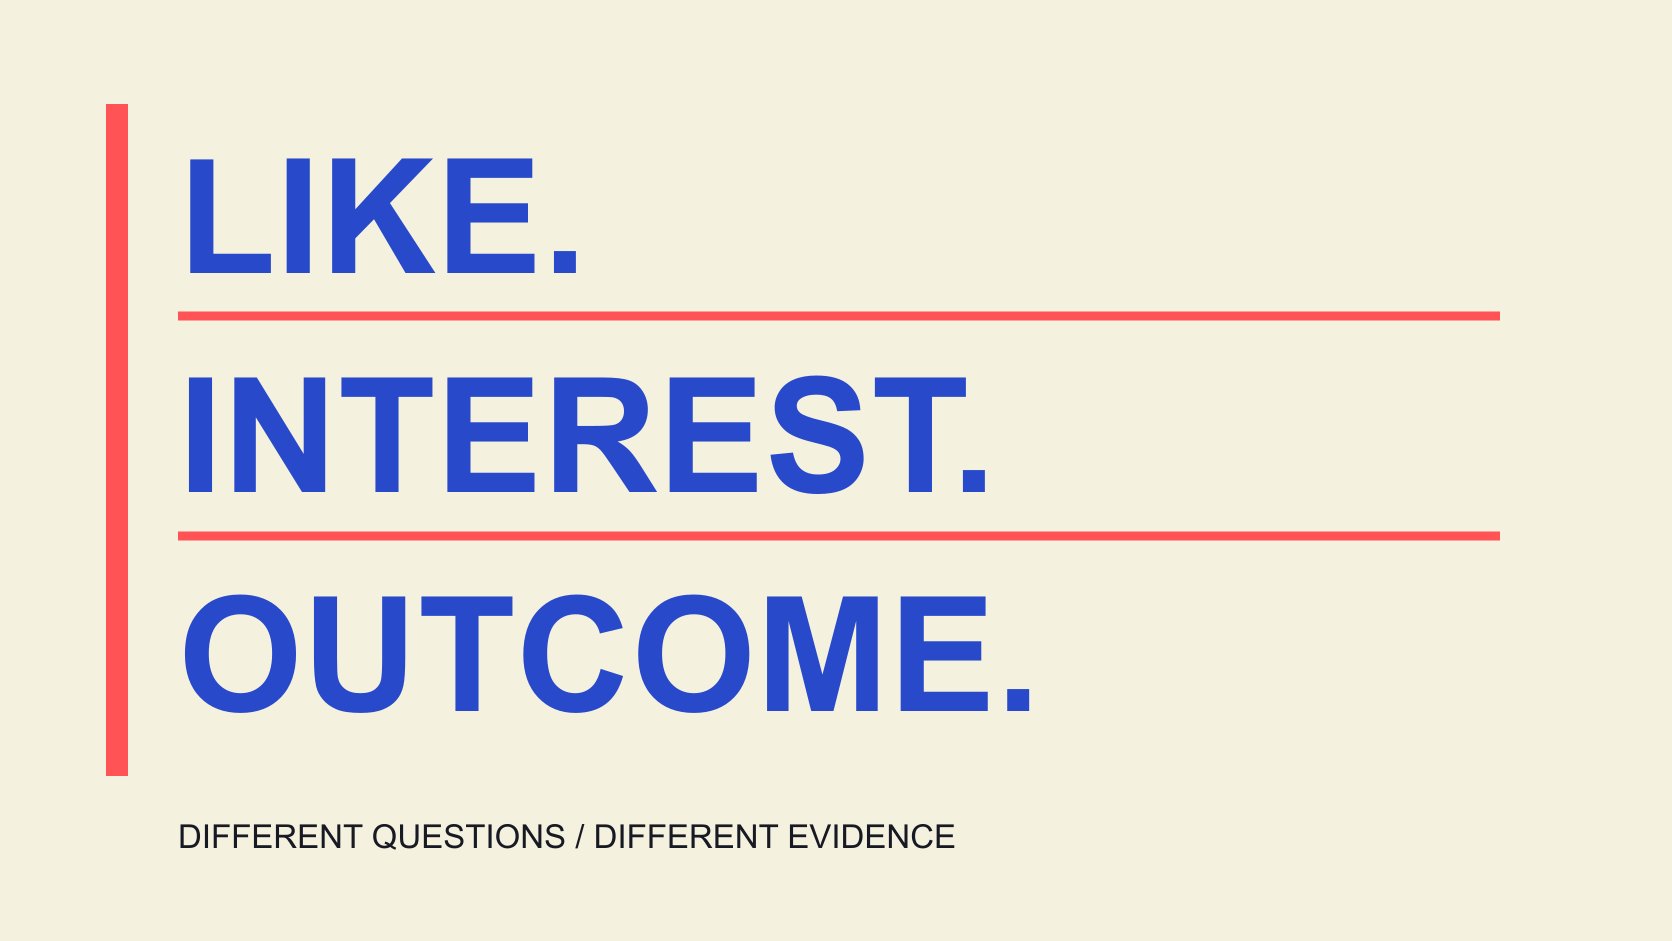
Free TikTok Likes: Understand Engagement Evidence
A free-likes promise is not evidence of genuine preference. Distinguish likes, views, audience and outcomes, identify missing evidence and report content response accurately.

Benchmarking: Design Comparisons for a Creator Pilot
Choose comparison objects, definitions and action conditions before a creator pilot, separating historical baselines, peer references and targets rather than selecting a favorable benchmark afterward.
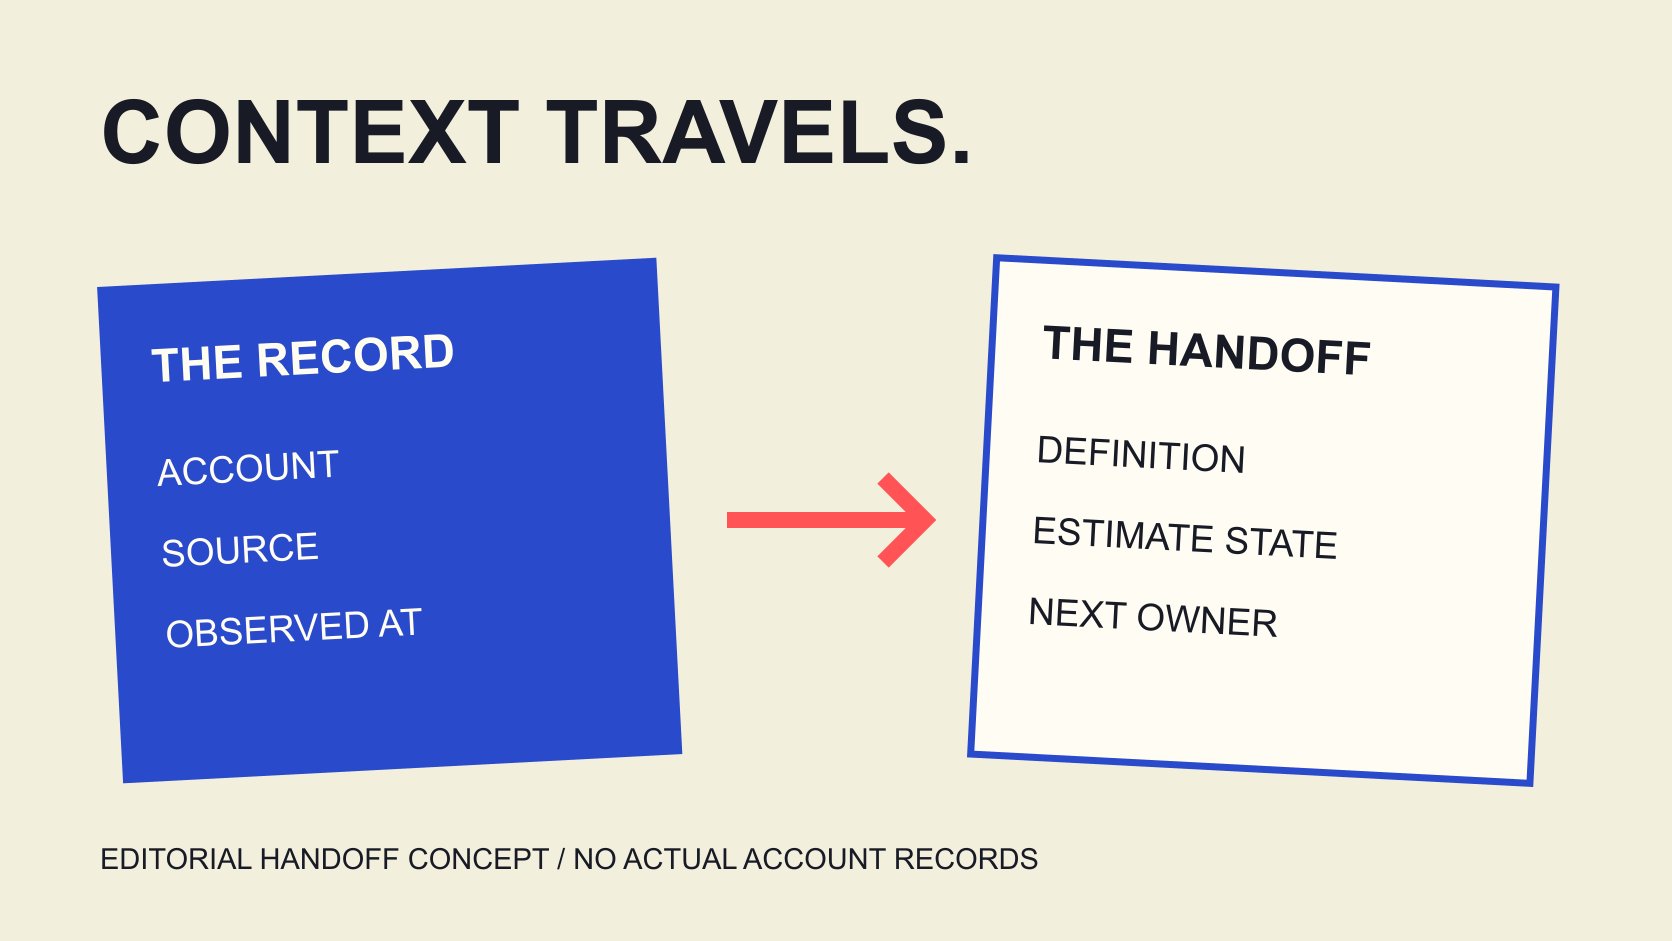
Socialblade Data: Preserve Source and Snapshot in Reports
When handing Socialblade public information to a colleague, retain account, source, observation time, metric and estimate state so the recipient can revisit the evidence and its limits.
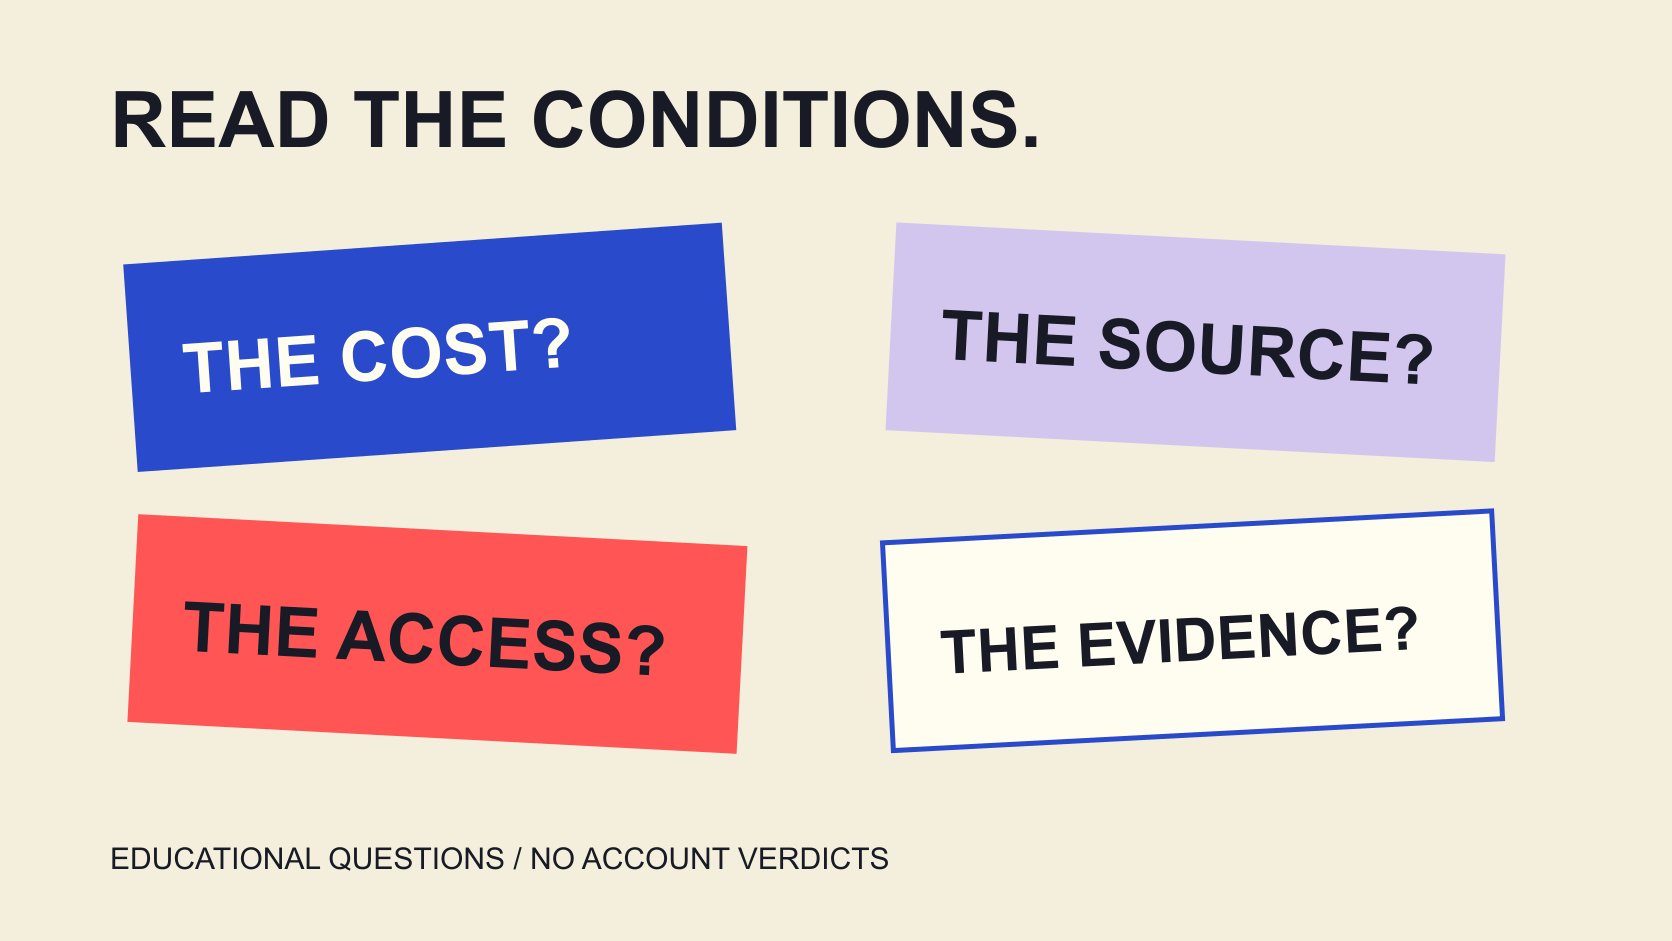
Free Instagram Followers Offers: Read the Conditions
Read free Instagram follower offers by separating price, conditions, access, source and outcomes, retaining verification questions without converting suspicious signals into established accusations.

Free Instagram Likes: Understand Distorted Comparisons
Learn how extra, incentivized or unexplained likes affect comparisons. Keep metric and distribution conditions, and distinguish uncertain signals from established facts.
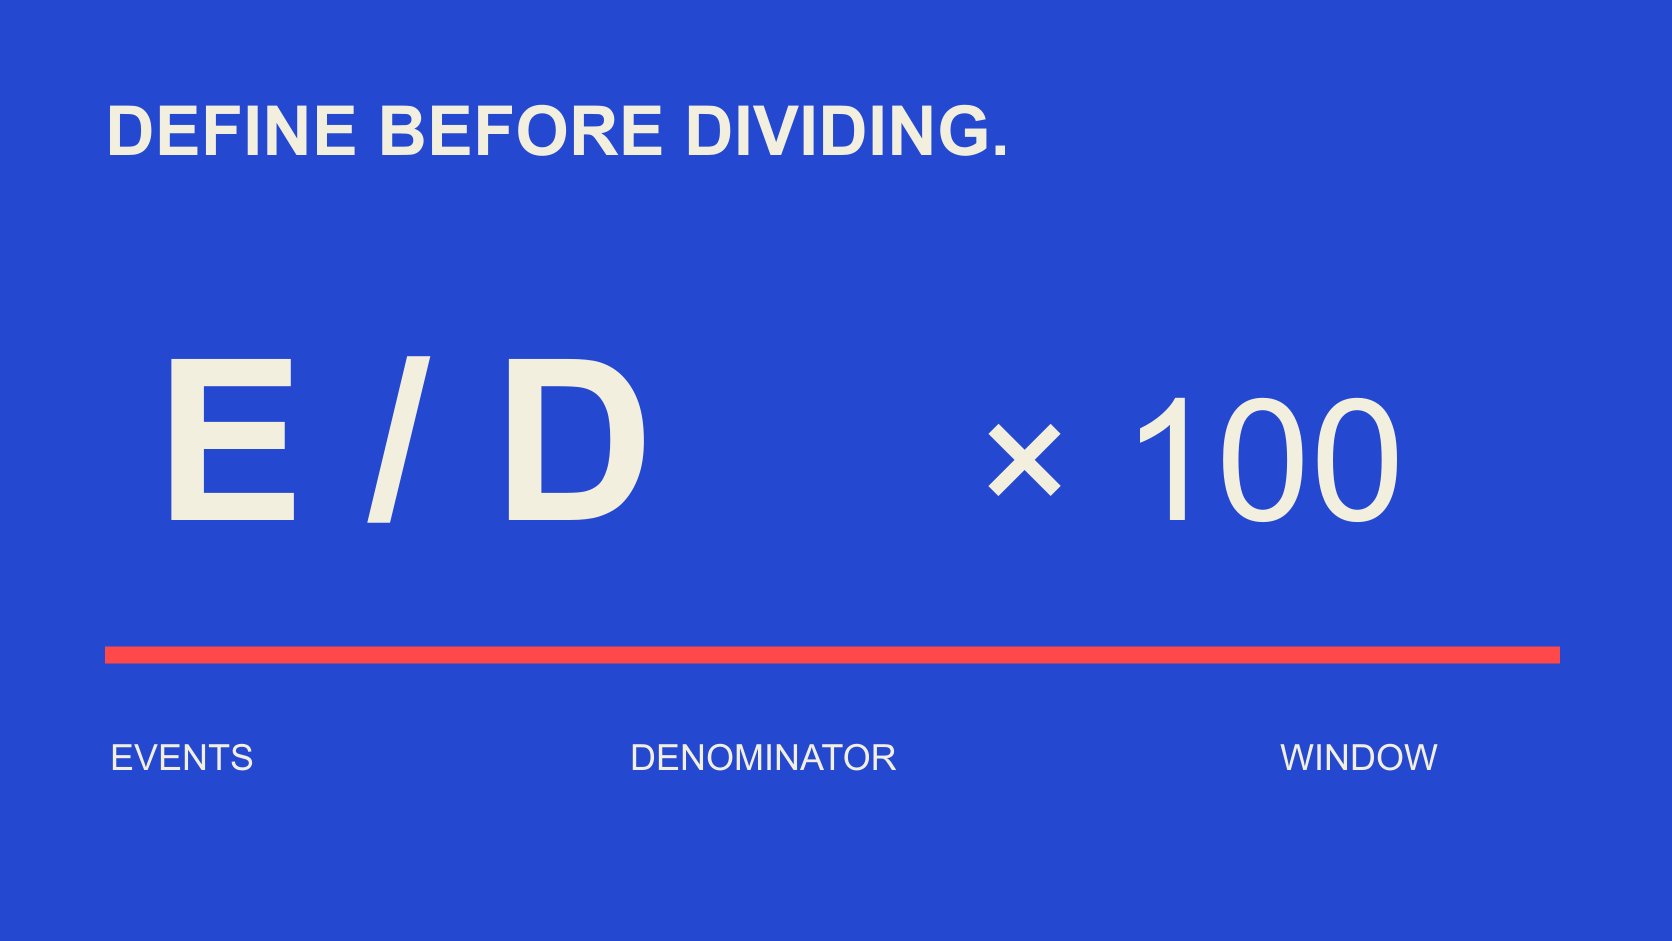
Engagement Rate Formula: Write the Metric Contract
When engagement rates move between reports, providers and teams, document actions, object, window, unit and version so an unchanged label does not conceal a changed measure.
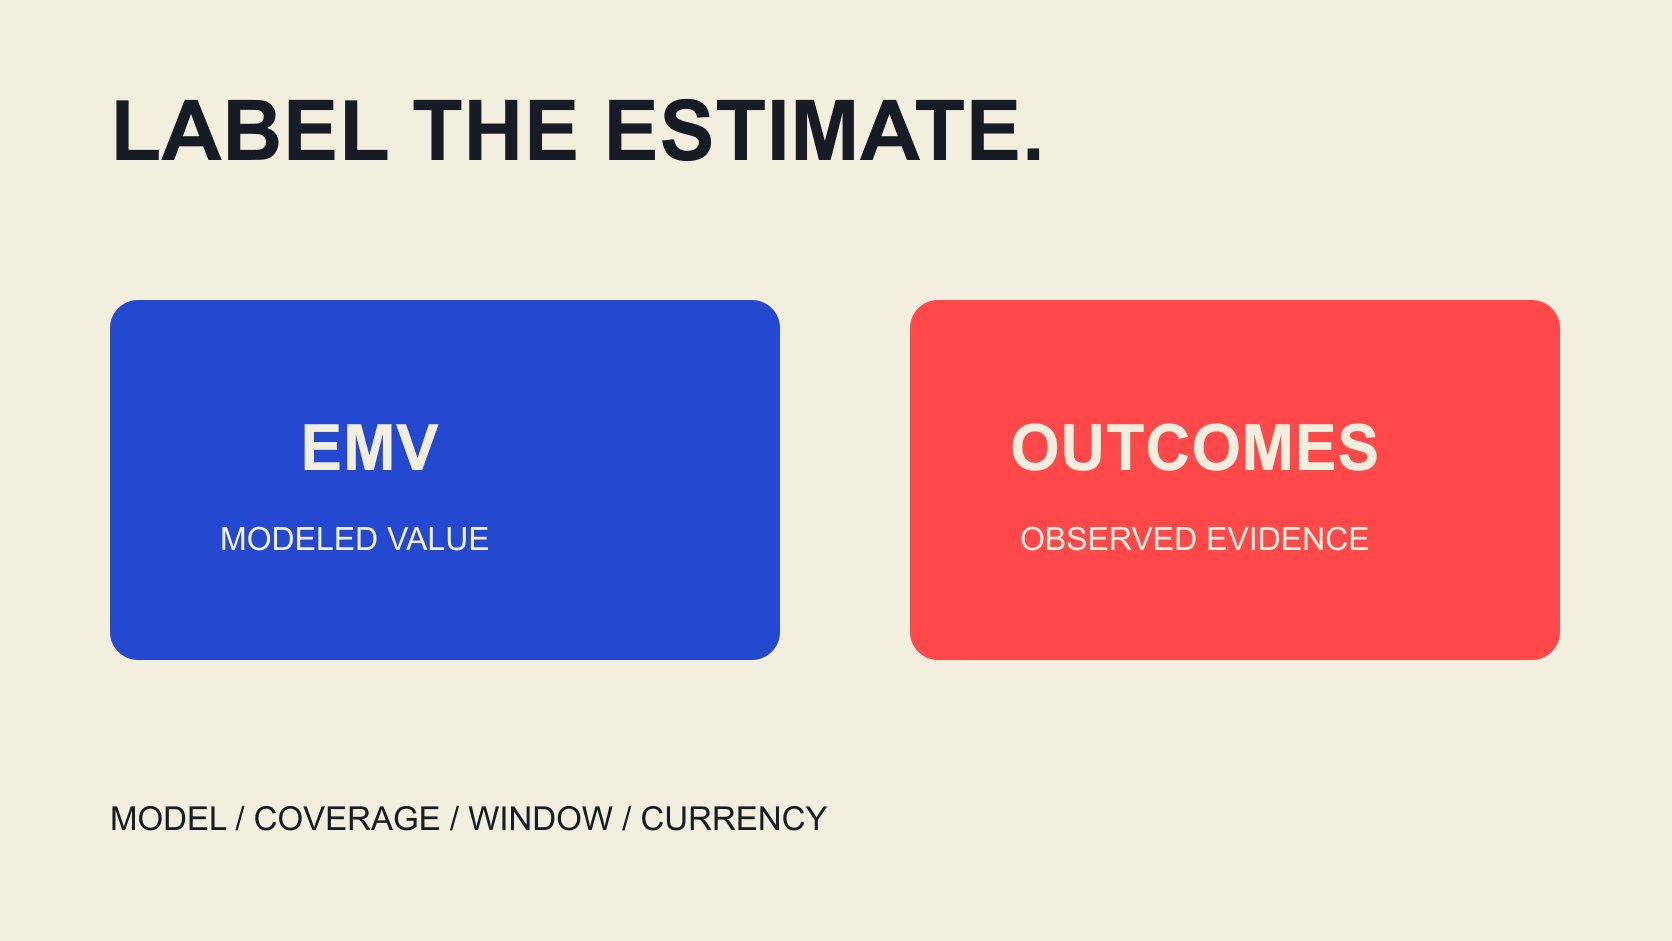
EMV Meaning: Annotate the Executive Report
Make EMV understandable in an executive report: label model and scope, separate valuation from spend and outcomes, and use an adaptable reporting note.
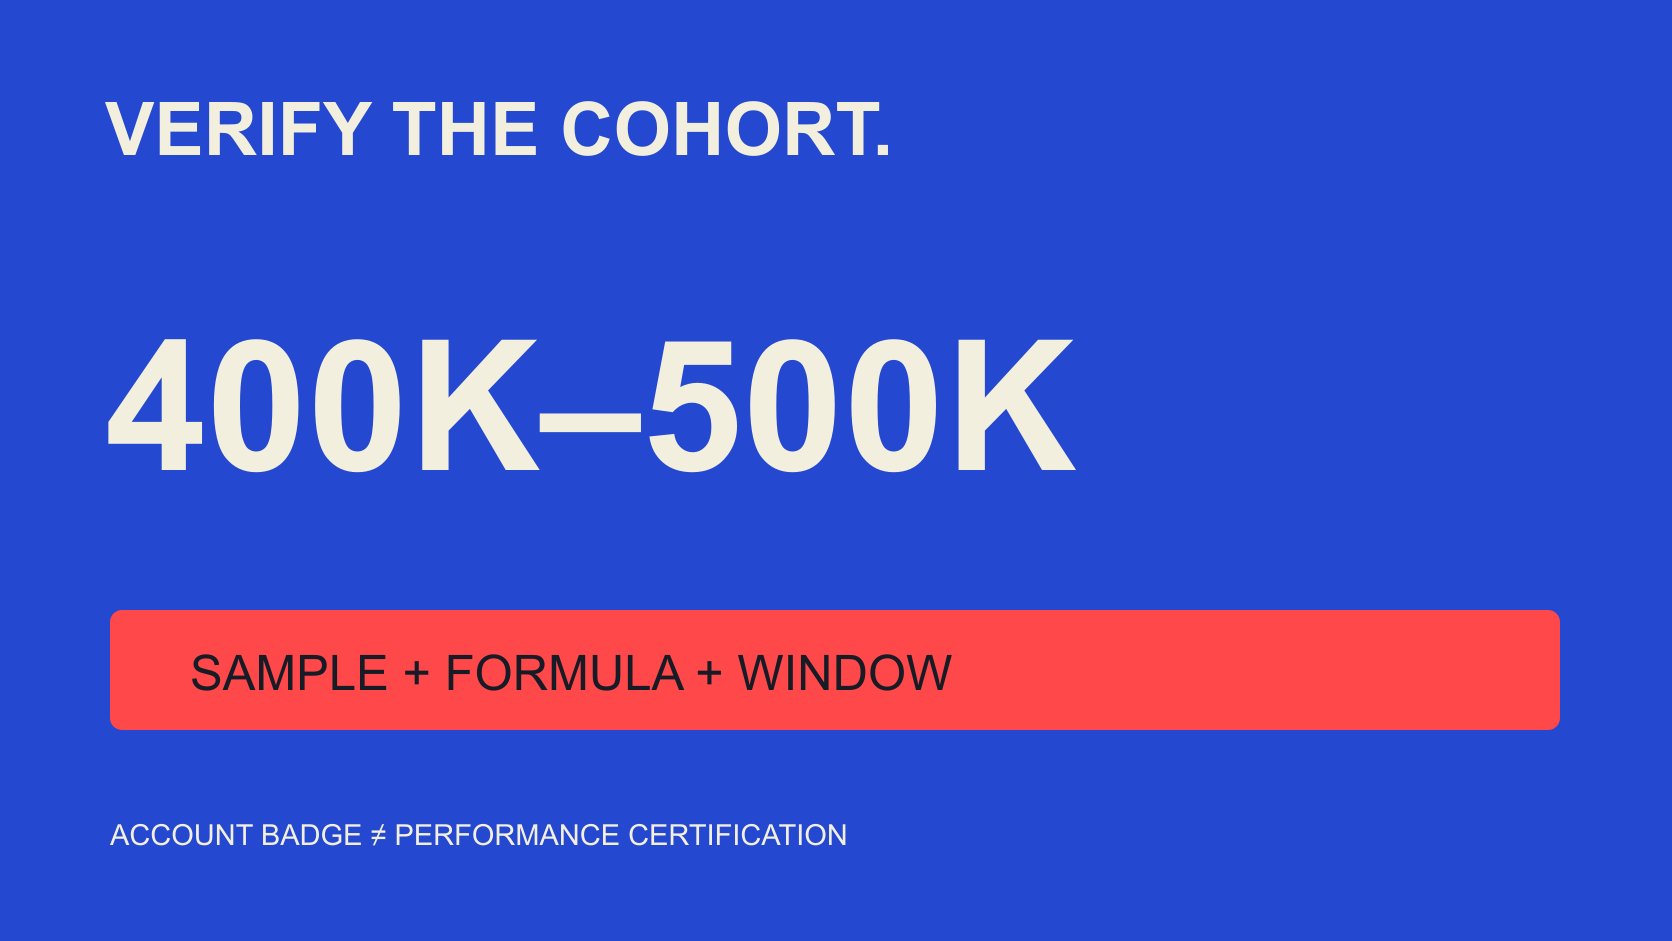
TikTok Creators With 400K–500K Followers: Verify the Cohort
When an exact cohort average is not verified, do not substitute a broad industry number. Define follower band, badge state, content and statistical method before interpreting data.
Web3 Instagram Follower Quality in 2024: Read the Evidence
An educational guide to reading 2024 Web3 and Instagram audience reports: inspect historical records, source independence and units, separating signals, interpretations and established facts.
FROM INSIGHT TO ACTION
Turn your next idea into your next campaign.
Start with a brief. Let QuickKOL help you find the right creators.