
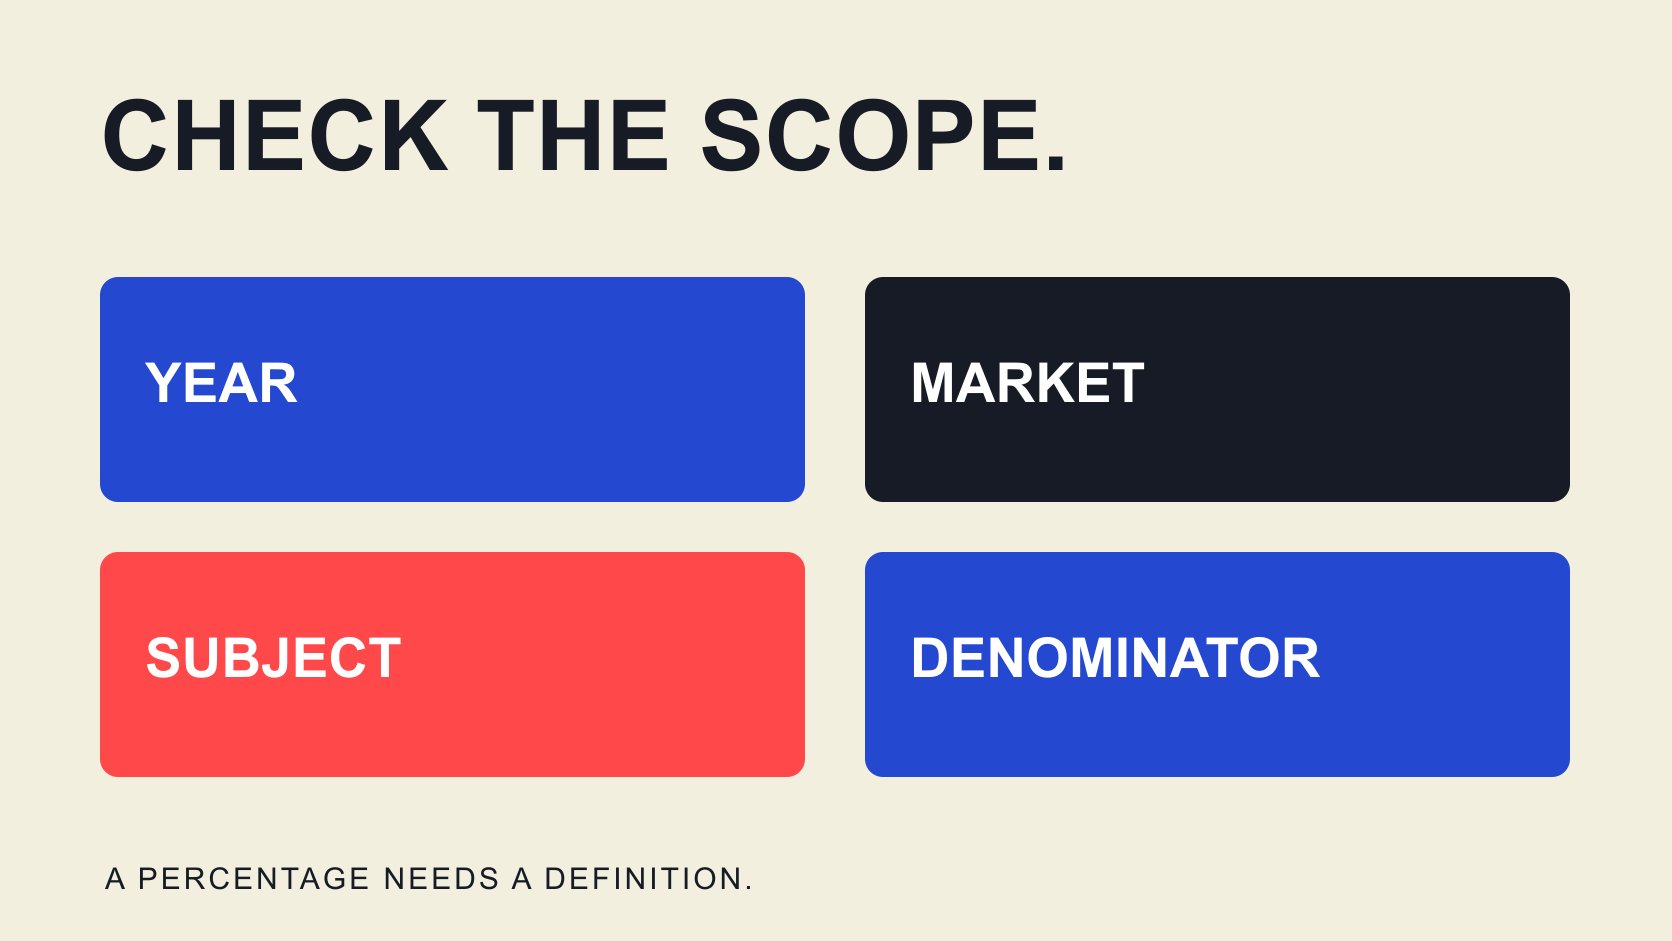
QuickKOL editorial graphic; not actual account metrics or a platform interface.
THE SHORT ANSWER
This review did not establish a responsibly citable average engagement rate for the Philippines beauty industry in 2025. That is not a claim that nobody has relevant data. The sources located did not jointly establish the year, Philippine scope, beauty subjects, platform and statistical definition required. Do not relabel global brand benchmarks, all-vertical creator medians or a later suggested range as that figure. A brand can instead define a comparable sample and report its descriptive results without presenting them as a national industry standard.
Specify who the requested average describes
Beauty industry may mean brand-owned accounts, retailers, individual beauty creators or a category of beauty-related publications. Philippines may describe creator location, a brand’s operating market, viewer geography or content language. These are different conditions, and the partnership question determines which matters.
If researching individual creators for a Philippine audience, explain both creator selection and audience scope. An account located in the Philippines does not establish that every interaction comes from the country. A global beauty brand does not become a local creator merely because its products are sold there. Language helps interpret content without independently proving viewer location.
The engagement data guide supports action definitions and limitations. Add platform, format, commercial status, follower band, observation window and sample unit. Define the question before accepting a percentage, rather than adjusting the question to accommodate a convenient number. A useful benchmark request should remain understandable when separated from the presentation in which it will eventually appear.
Why a beauty report labeled 2025 may still not match
The Dash Social 2025 beauty report explains that its H1 2025 edition analyzes global company activity from July 1 to December 31, 2024. Its Instagram beauty sample contains 257 brands. It also uses platform-specific formulas, with likes and comments relative to followers on Instagram and a different action set and denominator on TikTok.
Those details support a comparability assessment, not a Philippines 2025 individual-creator average. Preserve report year versus observation year, company versus individual and global versus national scope. A credible publisher does not make the sample conditions optional.
This article does not use the report’s percentages as local creator qualification thresholds. Broad industry context can be labeled as the specified global brand sample; a local partnership decision needs evidence closer to that task. A planning deck can carry both types of information if their different purposes remain explicit. It should not place a contextual figure above a local shortlist in a way that implies a comparison the data cannot support.
A Philippine creator table is not automatically a beauty average
The AnyMind Philippines sample note appears on page 68 of State of Influence in APAC 2026. It describes approximately 4,000 Philippine influencers with 1,000–1,000,000 followers across all influencer verticals, and the table presents medians and quartiles. The geographically relevant table does not isolate beauty.
An Instagram or TikTok tier median therefore cannot become a Philippines beauty industry average. The panel also does not fully establish the observation window and formula needed for independent reproduction. Do not reconstruct unstated panel conditions from the overall report title. We read its scope information and inspected the original table image; commentary below the table is not adopted as causal evidence of efficiency.
Use it as explicitly labeled all-vertical, tiered sample context, or ask the publisher for a beauty breakdown with the relevant observation period and formula. Without that breakdown, preserve the gap. A nearby spending chart mentioning fashion and beauty does not establish that the separate engagement table uses that same industry subset.
Keep means, medians and pooled rates distinct
The Rival IQ 2025 methodology relates engagement to followers and summarizes industry performance using company-sample medians. We cite that methodological distinction without treating its company results as an arithmetic mean for individual Philippine beauty creators. Preserve the page’s stated timing and selection conditions rather than silently repairing ambiguities.
Consider three hypothetical records, one post per account, with follower counts of 1,000, 10,000 and 100,000. Defined-window likes plus comments are 50, 100 and 500. Their respective follower-based rates are 5%, 1% and 0.5%. The arithmetic mean of those three rates is approximately 2.17%; the median is 1%.
Dividing 650 total actions by 111,000 total followers produces approximately 0.59%. That pooled rate is neither the simple mean nor a rate among deduplicated audience members. Every number is instructional, not Philippine data, an actual account observation or an industry benchmark. Choose a summary for the question and state whether accounts receive equal weight. Different answers can be mathematically correct while describing different things.
Build a scoped comparison sample for 2025
Write inclusion and exclusion conditions first: platform, individual versus brand, relevant beauty work, geographic evidence, follower tier, publication period and format. Find candidates through appropriate public or authorized sources and retain why each qualifies. Do not select only familiar accounts or the strongest observed performers.
Historical work especially needs publication time separated from capture time. A 2025 post inspected in 2026 includes subsequent accumulation; it is not an end-of-2025 snapshot. Without suitable historical followers and windows, current follower counts cannot silently become past denominators or establish equal-age post comparisons.
When historical evidence is unavailable, redefine the task as a retrospective of 2025 publications captured on a stated later date, or establish a comparable observation baseline going forward. These can still be useful without answering the original snapshot question. Narrow the claim before paying for more collection. Ask a data supplier for the actual available history rather than assuming a historical filter means every underlying metric was recorded at that historical moment.
Handle missing values and uneven sampling
The Instagram format decision guide distinguishes reporting objects and definitions. Separate Reels, feed images, Stories and other formats within the sample. Record giveaways, advertising amplification and organic publication according to evidence. Unknown distribution remains unknown rather than defaulting to organic.
Hidden likes or missing followers are not zero. Explain treatment of missing records and retain raw counts and sample sizes. An account posting a hundred times receives more weight than one posting twice in a pooled post-level average. If aggregating within accounts before comparing them, state that choice instead.
A high value is not automatically removable, and low performance should not disappear to improve a presentation. Check entry, window, format and definition, then document any justified exclusion. A small sample can support specific candidate research without representing an entire national industry merely because every spreadsheet cell is filled. Keep the usable record count distinct from the initial candidate count so missingness remains visible.
Present a result someone can reproduce
Place definition, platform, subject, period, geographic condition, sample size and aggregation beside the result. Describe a selected platform-specific beauty-creator sample and its account-level median within the stated capture window, with conditions and limitations. Do not shorten that into Philippines beauty average.
The beauty claims review guide separates personal experience, teaching and product claims. Examine engagement alongside the content assignment. A higher rate does not establish specialist explanation ability, substantiated product claims or future sales. A lower rate is not direct evidence of fraud or unsuitability.
If another report appears, check whether it actually closes the gap or merely offers a neighboring country, different year or similar denominator. Retain versions and sources so the reader can trace conclusions to records. Reproducibility is more useful for responsible citation than one attractive number.
Ask the data owner for the missing specification
A useful data request starts with the brand decision and required scope rather than asking only for a percentage. For this question, ask whether a Philippine individual beauty-creator subset exists, how geography and vertical are assigned, which platform is covered, and whether format and paid distribution can be separated. If the answer concerns brand accounts, confirm whether those subjects fit the decision.
Then ask for the actual observation window, capture time and basis for historical follower counts. Request the action definition, denominator, post-first or account-first aggregation, treatment of deleted posts or hidden values, and whether the summary is a mean, median or another statistic. Private raw records are not always necessary: an appropriate method description and non-identifying aggregate can help establish usability.
Finally, request the total and usable subgroup sample sizes, selection source and known missingness. A large overall number does not establish sufficient evidence in every subgroup. The owner may be unable to reconstruct a snapshot or split data as requested. Retain that answer and narrow the conclusion rather than asking them to guess. Knowing which part cannot be answered is a useful research result.
Before the response arrives, avoid placing suggested ranges in a deck where they resemble observed findings. Mark the matching sample and method as pending, with an owner and required evidence. After receipt, check whether the response closes the original gap rather than accepting it automatically because it came from a specialist supplier.
Make a bounded decision without a national average
A brand need not stop all research while waiting for a perfect industry number. Review relevant work, audience evidence and comparable observations, then consider an appropriately scoped pilot. Explain that the evidence supports a candidate and content decision rather than a national beauty-market estimate.
QuickKOL can support brief interpretation, relevant creator discovery and work research. Candidate data and historical definitions still require verification; a returned list does not establish representative sampling. Save subsequent observations under the same rule to build a useful comparison.
The defensible answer is a clear evidence boundary with a workable next step. Nearby data has value when it retains its actual name and scope.
Research date and limitations
Public sources reviewed October 30, 2026. No representative Philippine beauty dataset was collected and no 2025 national average was established. Relevant scope and methods in the Dash Social and AnyMind PDFs were checked. External reports retain their periods, samples and definitions. Instructional calculations are wholly hypothetical, not market observations. Confirm the publication date before release.
Which evidence answers the question?
Reviewed October 30, 2026. Failure to establish a matching public average does not assert that private or subsequent research does not exist.
| Evidence | Supports | Does not directly establish |
|---|---|---|
| Dash Social H1 2025 beauty report | Global brand context for a specified 2024 period | Philippines 2025 individual-creator average |
| AnyMind Philippine tier table | All-vertical creator medians and sample notes | Beauty-subset arithmetic mean |
| Rival IQ industry methodology | Company samples, medians and follower-based definitions | National standard for local beauty creators |
| A scoped comparison sample | Description of that sample under stated conditions | Unestablished national representativeness |
CHECKLIST
Before citing an engagement benchmark
Retain the conditions that make each figure meaningful.
- Does geography describe creators, audience or brand market?
- Is the sample beauty-specific, all-vertical, brands or individuals?
- Do report and observation years actually match?
- Are numerator, denominator, window and capture date explicit?
- Keep means, medians and pooled rates distinct.
- Disclose missingness, paid distribution and selection limits.
Sources and further reading
- 01Dash Social: H1 2025 Beauty Industry Benchmark Report, pp. 2, 17
- 02AnyMind: State of Influence in APAC 2026, pp. 5, 68
- 03Rival IQ: 2025 Social Media Industry Benchmark Report / Methodology
External pages can change. Recheck platform rules, contracts and local law before launch.